
Summary
The Q3 2025 Market Intelligence Report from Icon Foods dives deep into the shifting terrain of the food and beverage industry. From tariff upheavals and freight slowdowns to the FDA’s push to eliminate synthetic dyes, every section signals one thing: the rules are changing. This quarter’s report breaks down what’s hot (fiber, function, and monk fruit), what’s not (stable cocoa pricing), and how brands can pivot with confidence. Whether you’re navigating regulatory chaos, rethinking ingredient sourcing, or planning your next product launch, this report gives you the edge.
Edited August 8, 2025
Authored by: Kash Rocheleau, Icon Foods
Chief Executive Officer
As always, we deeply appreciate your continued support, interest, and loyalty in returning each quarter to read our take on what’s happening in the industry. You all were incredibly generous with your feedback as Thom and I co-led our first Market Intelligence Report last quarter. Over the years, Thom has built a strong following and earned a great deal of trust through these insights, and your kind words as we joined forces meant a lot to both of us.
This quarter brought its fair share of developments. Some we expected some that surprised us, and others we thought would break us — but didn’t. The announcement from HHS regarding synthetic dyes certainly caused a stir in the clean label space. On the tariff front and the GLP-1 conversation, it’s been quieter than expected. That’s not to say nothing is happening—GLP-1 usage remains strong, and tariff negotiations are actively underway, but they haven’t been center stage. That said, there are some key dates on the horizon that could shift that dynamic quickly.
Let’s dig in!
What’s Hot and What’s Not
Tariffs: The Topic That Won’t Go Away
It seems like every conversation we’re part of circles back to one thing: tariffs.
This document from the Trump Administration may be a helpful resource (since tariffs are changing frequently, this information may be out of date). It outlines the baseline tariffs by country. That includes ingredients like allulose and stevia, which remain exempt from the new sweeping tariffs — but not from baseline tariffs or ongoing supply chain headwinds.
“Tariffs are no longer a temporary disruption — they’re becoming a permanent fixture in global ingredient sourcing.”
What now?
While no one has a crystal ball, it’s becoming increasingly clear that tariffs — in some form — are here to stay. Some categories may still see exemptions or relief, but by and large, trade restrictions are becoming a permanent part of modern importing.
If you’re sourcing from these regions or relying on clean-label ingredients like erythritol, monk fruit, stevia, inulin, or soluble tapioca fiber, now’s the time to review your purchasing strategy.
We’re always here to help navigate the storm.
Ocean Freight: The Hidden Cost Behind Tariff Relief
Freight costs domestically have remained fairly steady, though as we all know, they ebb and flow with seasonality and demand. One area we’re keeping a particularly close eye on is ocean freight and container pricing.
When the sweeping tariffs were first implemented, imports essentially came to a standstill. There was a great deal of confusion and uncertainty: would the tariff be assessed based on the BOL date or the import date? Would the tariff be 25% or 245%? The risks were simply too high for many importers to take.
In early June, I was in California and drove past the Port of Long Beach, the second busiest U.S. port, which handled 9,649,724 TEUs (twenty-foot equivalent units) in 2024. At the time, only two ships were being unloaded, with nothing waiting behind them. A few weeks later, I was in New Jersey and drove past the Port of New York and New Jersey, the third busiest port (8,698,526 TEUs in 2024). Only four ships were being unloaded, and again, nothing in queue. Newark looked eerily inoperable.
To put this perspective
- Long Beach averages 26,437 TEUs per day.
- New York/New Jersey averages 23,832 TEUs daily, or roughly 8 ships per day over 2024 (2,678 ships total).
If you think back to the height of COVID, we were dealing with severe port congestion and significant delays. To now see ports this quiet is concerning, especially as these slowdowns ultimately hit consumer shelves—or in this case, don’t. (I’ll link the full report for the New Jersey port here if you’re curious. These reports are publicly available via port authority websites.) https://www.panynj.gov/port/en/our-port/facts-and-figures.html
Because of the slowdown, ships have been sitting longer at ports trying to maximize cargo loads before setting sail, which has caused further delays. I can speak to this firsthand — we’ve had several shipments delayed because vessels stopped at multiple ports in hopes of filling up before crossing open water.
This drop in shipping activity has also driven up costs. At the start of the year, container rates ranged from $2,500 to $3,500. Today, we’re seeing prices between $4,800 and $6,500, with some as high as $8,800.
So while we may have received some reprieve on tariffs, much of that savings has been offset by rising freight costs, meaning landed costs haven’t shifted much despite the temporary tariff pause.
Synthetic Dye Ban Moves Forward: FDA Targets 2027/2028 Removal
In the last Market Intelligence Report, we touched on the MAHA movement. Since then, one of the biggest developments has been their push to ban synthetic dyes.
On April 22, HHS and the FDA announced they are working on a timeline to remove synthetic dyes from the U.S. food supply, targeting removal by 2027/2028. The six dyes on the list include (https://www.fda.gov/news-events/press-announcements/hhs-fda-phase-out-petroleum-based-synthetic-dyes-nations-food-supply):
- FD&C Green No. 3
- FD&C Red No. 40
- FD&C Yellow No. 5
- FD&C Yellow No. 6
- FD&C Blue No. 1
- FD&C Blue No. 2
There is also significant pressure to accelerate the removal of Red No. 3 ahead of the full 2027/2028 deadline.
While Icon Foods is a strong advocate for clean label — and we don’t play in the world of colorants — synthetic dyes are certainly not clean label. That said, as a manufacturer, we also understand that making changes like this isn’t as simple as flipping a switch.
Replacing synthetic colors requires:
- Testing and validating new ingredients
- Vetting new suppliers
- Making packaging changes to update ingredient statements and declarations
- Managing the impact to COGS
And all of this comes at a cost — a cost that ultimately trickles down to consumers, who are already feeling it at the grocery checkout.
There are also sustainability concerns. For manufacturers sitting on significant packaging inventory (sometimes millions of dollars’ worth) that includes ingredients slated for removal, much of that packaging would become unusable and likely end up in landfills.
One of the less talked about challenges is formulation itself. Natural colors simply aren’t as vibrant and, in some cases, they serve functional roles beyond just aesthetics. For example, consider America’s favorite beverage — cola. The caramel color used provides not only the signature color but contributes to its characteristic flavor. Finding alternatives that satisfy both visual and flavor expectations will require time, R&D, and a level of compromise from both formulators and consumers.
One thing to keep an eye on is state-level legislation. While the FDA is setting guidelines at the federal level, some states are taking a more aggressive approach and moving to ban these dyes ahead of the proposed federal timeline. This creates an added layer of complexity for CPG brands.
“Replacing synthetic dyes by 2027 will reshape clean label formulation strategies across food and beverage.”
Brands will be faced with a choice:
- Maintain multiple SKUs to meet varying state regulations
- Reformulate to meet the strictest state standards and adopt a single formulation that works across all markets
Neither option is simple. Managing multiple formulations increases manufacturing complexity, inventory management challenges, and cost. On the other hand, formulating to the strictest standards can require additional time and R&D to get the product right, particularly when natural alternatives don’t always perform the same as synthetic dyes.
In April, PepsiCo announced it would remove synthetic dyes from Tostitos and Lay’s by the end of 2025. Nestlé followed suit, stating it plans to eliminate artificial colors from its U.S. product portfolio by mid-2026. Both Kraft Heinz and General Mills have also committed to removing synthetic dyes from their U.S. products by 2027.
If there’s one thing I’ve learned in this industry, it’s this: when the major players start making moves, change is inevitable. These timelines signal a clear direction for the market and it’s only a matter of time before the rest of the industry is expected to follow suit.
Proposed Changes to SNAP Could Limit High-Sugar Purchases
Another area we’re closely watching is the growing conversation around SNAP benefits and what products are eligible for purchase. While no mandates have been implemented yet, HHS has signaled an interest in tightening eligibility requirements, and Robert F. Kennedy Jr. has been vocal in pushing for restrictions on foods high in sugar.
Under these proposals, products like soda, sugary beverages, and candy could potentially be removed from the list of SNAP-eligible items. While still in the early stages, if these changes move forward, it could have a significant ripple effect on consumer behavior, particularly for brands and retailers who serve lower-income demographics that rely heavily on SNAP benefits for grocery purchases.
Fiber is Flowing, Protein is Powering — And Functional Isn’t Slowing
Functional ingredients continue to dominate the conversation — whether it’s protein and fiber, or benefits like mental clarity, better sleep, or gut health. And we don’t see that trend going anywhere anytime soon.
At Icon, we’ve been doing quite a bit of work with fiber. Over the last quarter, we introduced several fiber blends and are actively developing new tools to help mask protein off-notes, especially in plant-based formulations. Fiber in beverages shows no signs of slowing down.
Look at the recent activity in the space:
- Alani Nu’s acquisition by Celsius for $1.8B
- Poppi’s acquisition by Pepsi at nearly $2B
“Functional ingredients like fiber, protein, and allulose continue to dominate innovation pipelines — especially in beverages.”
Those deals sent shockwaves through the soda category and now the big question is if and when will Olipop make a move — and at what valuation?
On the high-protein front, brands like OWYN, Fairlife, Huel, and Slate continue to lead the charge. The beverage aisle is getting more competitive by the day, and the consensus at BevNet seemed to echo that — the momentum isn’t slowing.
Cargill AD/CVD: Where Things Stand Now
One thing that may not be on your radar is the Anti-Dumping (AD) and Countervailing Duty (CVD) case that Cargill filed onDecember 13, 2024. (https://www.trade.gov/initiation-ad-and-cvd-investigations-erythritol-china)
Following the filing, importers and distributors were asked to submit detailed questionnaires by December 27 for a hearing held on January 3. As expected, the International Trade Commission (ITC) determined there was enough evidence to proceed. It’s rare for the ITC to reject these filings, so this came as no surprise. The case then moved to the Department of Commerce (DOC) for further review.
Quick Refresher: What Are AD and CVD?
- Anti-Dumping (AD): When a foreign company sells a good in the U.S. below market value — often due to government subsidies — AD duties are levied to bring prices back to fair market levels.
- Countervailing Duties (CVD): These offset those foreign subsidies, like low-interest loans or direct financial support, to level the playing field.
Erythritol Market Contraction
Due to the sweeping tariffs, the AD/CVD uncertainty, and the retroactive risk, erythritol imports slowed to a trickle. This created a noticeable contraction in the market, particularly in the non-GMO and organic segments — areas where Cargill does not currently supply. Inventory is tighter, prices are climbing, and supply chain anxiety is real.
“The erythritol market is tightening fast — tariffs, AD/CVD duties, and retroactive risk are driving up prices and supply chain anxiety.”
Why We’re Fighting
At Icon Foods, we are actively opposing this petition. The U.S. erythritol market is valued at $224M, and Cargill already supplies about 70% of it (https://www.gminsights.com/industry-analysis/erythritol-market). Their AD/CVD filing, in our view, only adds unnecessary pressure on an already tight market, especially for clean label brands that need non-GMO and organic options.
Cargill has claimed erythritol’s fair market value is $7.21/kg, yet industry chatter says they’re offering “take-or-pay” contracts at around $3.48/kg. The disconnect is significant and worth paying attention to.
What You Can Do
- Have honest conversations with your supply chain partners. What are they doing to secure stable supply and manage risk?
- Stay informed on pricing. Don’t assume the sticker price is the full story — understand what’s driving it.
- Review contracts carefully. If you’re considering a long-term agreement, make sure your legal team reviews it. The wrong clause could cost you more than just margin.
How Icon Foods Has Your Back
We’re well-stocked and taking proactive steps to support customers who are ready to work collaboratively. We’re not just here to sell — we’re here to help you navigate what’s next.
We’ll continue to keep you informed as this unfolds. Let’s stay ahead of it together.
Innovation Isn’t Dead, It’s Just on a Tighter Budget
The word “recession” has been floating around more and more lately — in headlines, on investor calls, and in just about every conversation where the economy comes up. And while no one has officially sounded the alarm, there’s no denying we’re seeing some classic warning signs: consumer spending is tightening, interest rates are still sitting high, and capital feels harder to come by than it did just 12–18 months ago.
From where we sit, it feels less like a sudden crash is coming and more like a slow bleed — one that’s already impacting certain industries more than others. Food and beverage have held on fairly well compared to tech or housing, but we’re starting to see more cautious purchasing patterns and longer sales cycles even in our world.
The Federal Reserve has been playing a balancing act, trying to keep inflation in check without tipping the economy into a full-blown downturn. Rate cuts were teased earlier this year but have been kicked further down the road as inflation remains sticky in key categories like housing and services. For food and beverage businesses, this means continued pressure on borrowing, slower access to capital, and a more risk-averse investment landscape. The cost of growth — whether it’s new equipment, innovation, or marketing — just isn’t as cheap as it used to be.
For CPGs, this kind of environment forces tough choices. Innovation doesn’t stop, but it gets more selective. R&D teams are being asked to stretch ingredients further, cut costs without compromising quality, and make products that deliver on multiple fronts — function, taste, label, and price. There’s less appetite for moonshots and more pressure to create “safe bets” with clear ROI.
Retailers, for their part, are tightening their category review windows and getting pickier about what makes it to the shelf. They’re looking for high-turn, low-risk items, and brands that can carry their weight with velocity, margin, and consumer demand already baked in. If your product isn’t solving a problem — whether that’s price, health, or indulgence — it’s probably not making the cut.
All of this put’s pressure on emerging brands and suppliers alike. But it also creates opportunity. The brands and partners who can deliver meaningful value — clean label, functional benefit, cost stability, or operational agility — are the ones that will stay standing. Innovation hasn’t gone away; it’s just being filtered through a much more practical lens.
The Job Market’s Not Crashing, But It’s Definitely Not Coasting
Let’s talk jobs. Whether you’re hiring, job hunting, or just trying to read the economic tea leaves, the labor market is shifting.
As of May 2025, the U.S. added 143,000 new jobs — a solid number, but still short of economist expectations (which were closer to 160,000). Unemployment inched up again to 4.2%, from 4.1% the month prior. That slow climb, paired with job creation missing targets, suggests that while we’re not in a downturn, we are definitely cooling off.
One thing that raised eyebrows: job openings surged to 8.4 million, up from 8.2 million in April. Strong demand? Sure. But it also hints at a growing disconnect between open roles and qualified candidates.
Here’s where the jobs are showing up:
- Healthcare is still leading the charge (+48,000), and that’s not changing anytime soon.
- Financial services added another 19,000 positions; banks and fintechs are cautiously expanding.
- Transportation and warehousing remained solid (+15,000), likely tied to supply chain stabilization and e-comm demand.
- Social assistance bumped up (+9,000), signaling continued pressure on community services.
- Federal government employment fell by 12,000 — continuing a downward trend, mostly attributed to cuts in the Department of Energy and related administrative support (yes, DOGE gets the blame again).
What’s not being talked about enough? The labor force participation rate dipped to 62.3%, and the number of people working part-time for economic reasons jumped by half a million to 5.1 million. That’s usually a sign of strain — people want full-time work but can’t find it.
Bottom line? The job market is still growing, but the edges are starting to fray. Hiring is slowing, part-time work is rising, and the unemployment rate is creeping up. Businesses should be watching wage pressure and staffing needs closely. For job seekers: now’s the time to get strategic. Things could get tighter before they get better.
We’ll keep watching this space — it’s shaping up to be a make-or-break year for workforce dynamics.
Economy Slows, Costs Stay High: What’s Next?
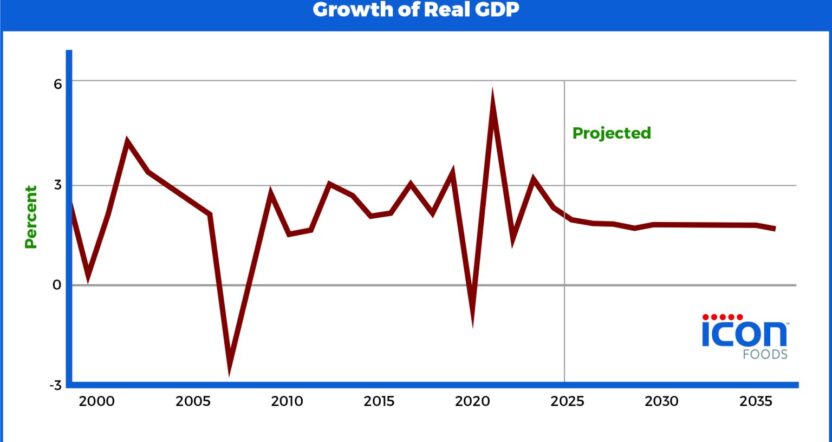
GDP growth is still positive. The latest numbers show the economy expanding at an annualized rate of just under 1.5%, down from earlier projections closer to 2%. That slowdown isn’t surprising given high interest rates, tighter credit, and cautious consumer spending. It’s not a collapse, but it does signal we’re in a period of slower growth where companies should be watching margins, tightening budgets, and making sure every investment has a clear path to return. In food and beverage, this means prioritizing projects that build real value, not just chasing shiny new ideas.
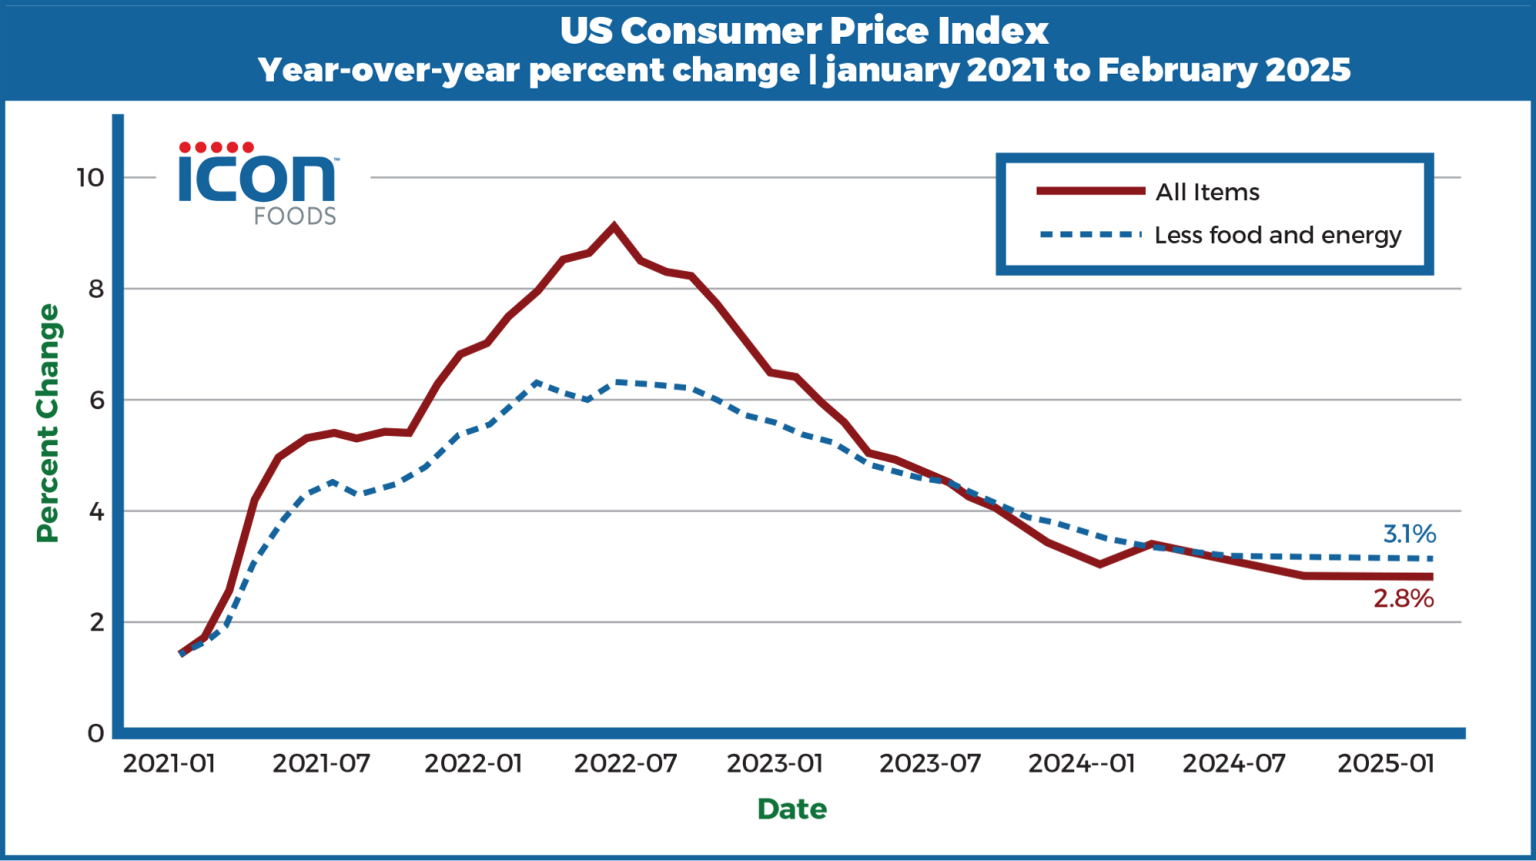
Meanwhile, the Consumer Price Index is still showing stubborn inflation in key categories. Overall CPI rose 3.2% year-over-year in May, slightly above expectations and driven by persistent increases in food-away-from-home, shelter, and services. While energy prices have softened a bit, core inflation remains sticky. For food and beverage companies, this means raw material costs and logistics aren’t likely to come down significantly anytime soon — and consumers are still paying more at the register, which will continue to influence how they spend and what they prioritize.
Corn: Calm on the Surface, But Keep One Eye Open
Corn has long been a cornerstone of the global ingredient supply chain and for once, the market feels… calm. U.S. corn prices are sitting in the $4.25–$4.35 per bushel range on the Chicago Board of Trade (https://www.cmegroup.com/markets/agriculture/grains/corn.html), and they’ve held steady for the past several months. For food and beverage manufacturers, that kind of pricing consistency is a welcome break. For growers looking to improve margins? Not so much.
But as always, what looks stable on the surface doesn’t tell the full story. Beneath that flatline are tightening inventories, international planting hiccups, and longer-term pressures quietly stacking up.
Domestic Supply Looks Strong; Globally, Not So Much
The USDA is projecting a record corn harvest for the 2025/26 season, with 15.585 billion bushels in production and 1.8 billion bushels in ending stocks. That’s great news for buyers relying on U.S.-sourced glucose, dextrose, or maltodextrin, with pricing expected to remain relatively stable over the next few quarters (https://www.ers.usda.gov/publications/pub-details?pubid=106608).
But globally, we’re looking at a different picture. According to the USDA’s June WASDE report, world corn ending stocks are expected to fall to 275.24 million metric tons — down from last year, with more tightening possible as weather patterns play out (https://www.usda.gov/about-usda/general-information/staff-offices/office-chief-economist/commodity-markets/wasde-report).
One key player to watch? Brazil. Late-season rains have delayed planting in critical states like Mato Grosso and Paraná, and it’s raised real concerns about second-crop yield potential. If those yields come in light, the ripple effects will hit global pricing fast.
Demand Isn’t Slowing Down
Global demand for corn is holding firm thanks to strong consumption across food, feed, and fuel (especially biofuels). That steady demand, paired with tighter supply outside the U.S., could start nudging prices up for corn-derived ingredients made abroad.
We’re keeping a close eye on erythritol and allulose coming out of Asia and Europe, where local corn availability and currency volatility can swing pricing in a hurry.
What We’re Watching
For now, the domestic corn story is one of stability. But here are the pressure points we’re monitoring:
- Brazil’s second crop yield report, expected later in Q3
- Export flow out of the U.S. Gulf and Pacific Northwest
- Tariff changes or new trade negotiations, especially for import/export of corn and corn-derived ingredients
Even with record crops in play, the smart move is to think ahead — secure your supply, keep your contracts flexible where you can, and don’t wait for the next squeeze before making a move.
You’ve got Icon Foods in your corner. We’re tracking the shifts, reading the signals, and helping you stay two steps ahead so you can focus on what matters most: launching the next product, hitting your targets, and building something sustainable.
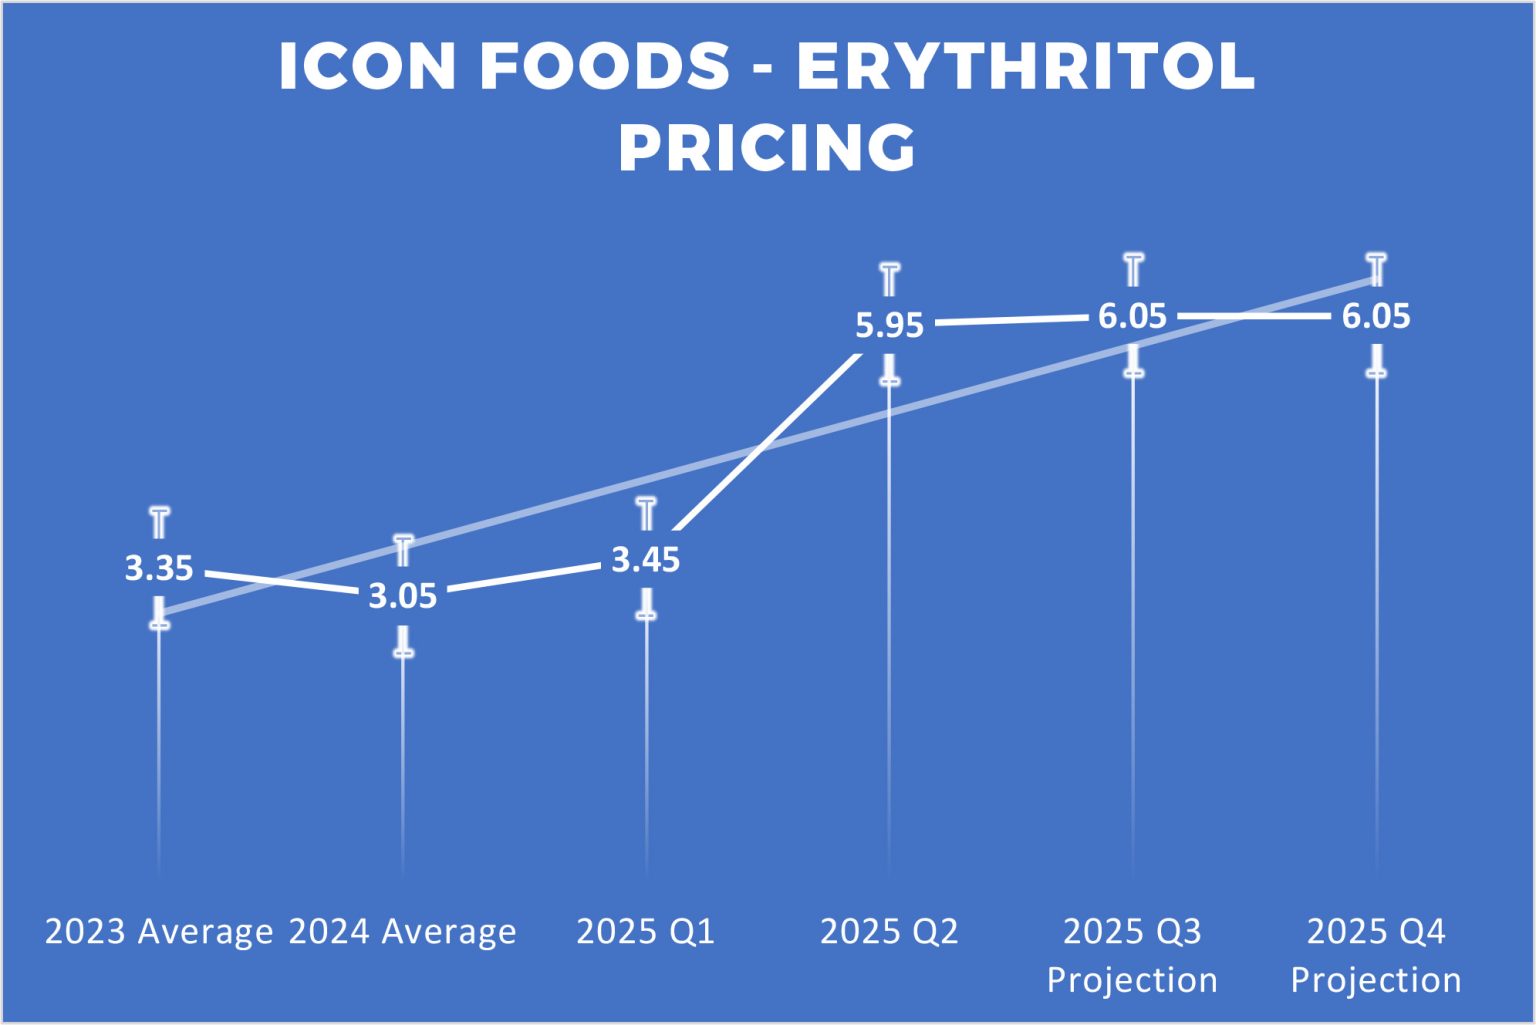
Erythritol
I touched on the Cargill anti-dumping case earlier, but it’s worth reiterating its current impact on the market. Although we’re in a retroactive period, limited importing is still occurring. Because anti-dumping and countervailing duties (AD/CVD) have not been fully finalized, importers are operating under uncertainty, knowing that fees could be applied retroactively. Some are choosing to take the risk, but to hedge against potential penalties they are inflating prices, putting additional upward pressure on costs across the board.
At Icon Foods, we’re working hard to mitigate these challenges. We’re absorbing costs where possible to protect our customers, while still maintaining the profitability necessary to sustain operations and long-term supply chain stability.
Despite these pressures, the global erythritol market continues to grow steadily. Current projections estimate the market will reach between USD 470 million and 544 million by the early 2030s, with a compound annual growth rate between 5.5% and 7.6%. Some forecasts are even more bullish, predicting the market could exceed USD 4 billion by 2025, fueled by expanded applications in food, beverage, pharmaceutical, and functional wellness categories.
Granulated erythritol remains the preferred format. The food and beverage sector continues to lead demand, especially in North America. Meanwhile, Latin America and Asia-Pacific are seeing strong growth, driven by rising consumer demand for sugar reduction, keto-friendly options, and clean-label products.
When it comes to erythritol, it’s a great sweetener on its own but it can be leveled up when paired with a high-intensity sweetener like stevia or monk fruit. These combinations help align the sweetness curve closer to a true 1:1 sugar replacement, while also improving taste by masking off-notes and reducing the cooling effect erythritol is known for. Additionally, these pairings can help limit digestive side effects, making the final formulation more consumer friendly.
On the production side, advances in fermentation-based manufacturing and AI-assisted formulation are enhancing both efficiency and competitiveness, enabling suppliers and formulators to better meet rising demand with more consistency and cost control.
Import costs for erythritol have become increasingly volatile due to trade actions and supply chain constraints. However, with the AD/CVD still pending finalization, importers are factoring in a risk premium of $0.50 to $1.00 per kg to cover potential retroactive fees. Freight rates, container availability, and port delays continue to influence the landed cost, putting significant upward pressure on import costs for many U.S. buyers.
Allulose
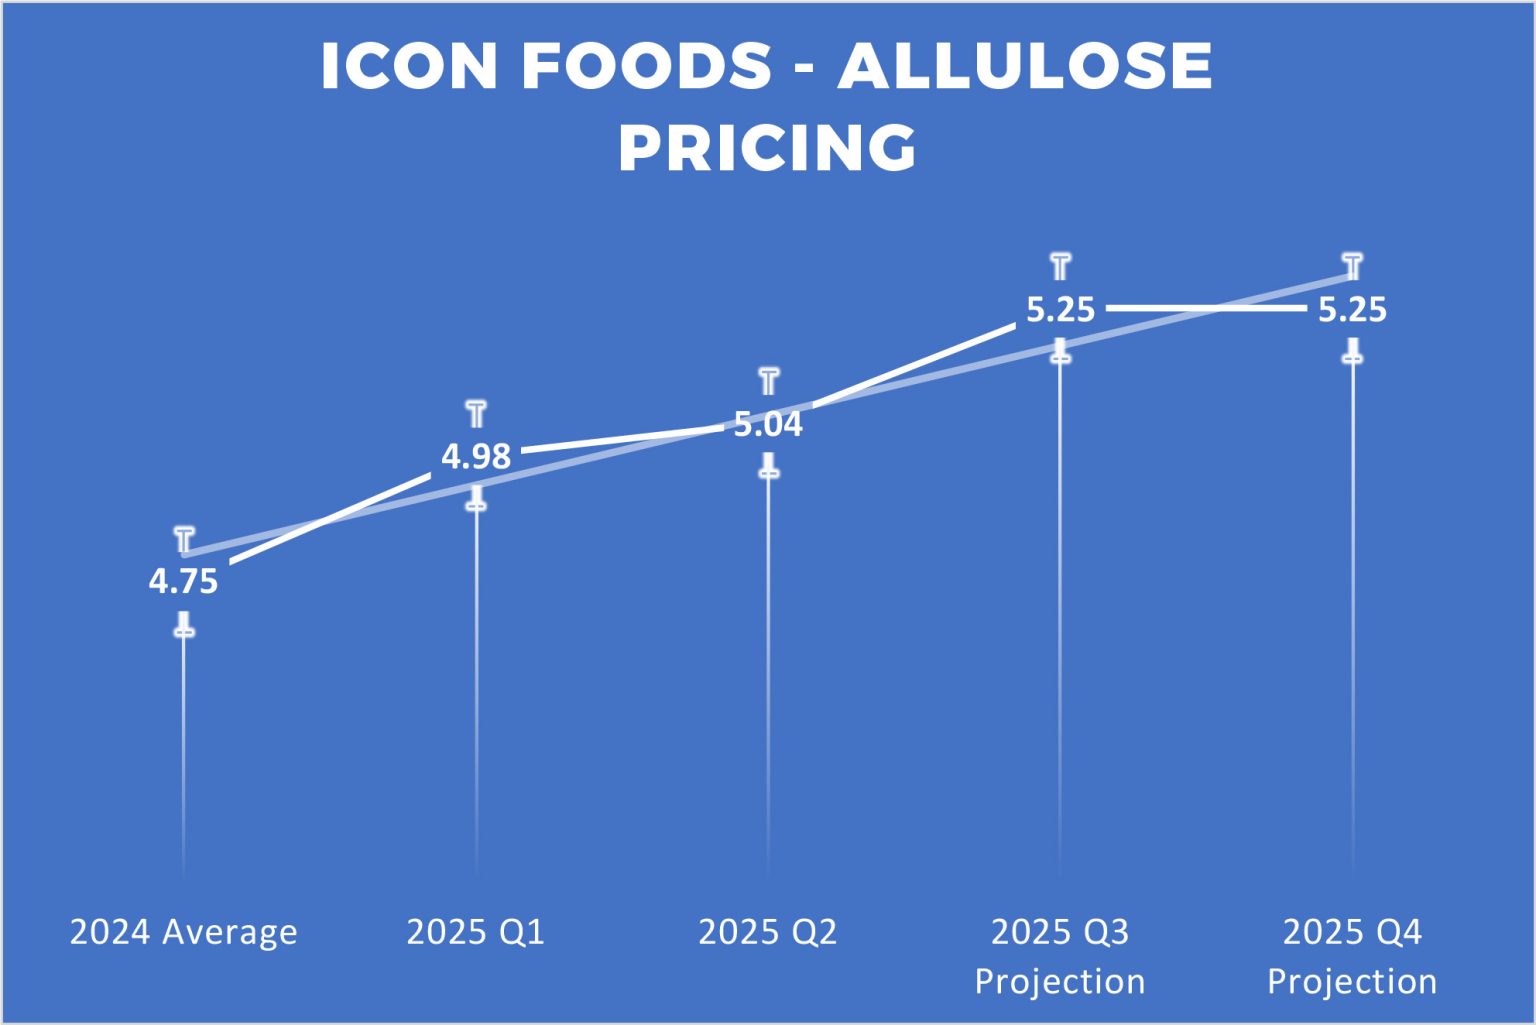
Import costs for allulose have become increasingly dynamic as suppliers navigate evolving trade policies and global logistics constraints. Allulose is currently exempt from sweeping tariffs but is still subject to the baseline tariff depending on the country it originates from. This could be particularly helpful in negotiations or if you see sudden spikes in your pricing due to “claims of tariffs.”
Despite these challenges, the global allulose market is experiencing significant growth. In 2024, the market was estimated to be worth just under $300 million, with forecasts projecting a rise to nearly $500 million by 2031. More aggressive projections anticipate the market could surpass $1 billion in the next decade, fueled by expanding applications in functional food, beverage, and sports nutrition categories.
Allulose powder remains the preferred format, especially in the U.S., where it benefits from GRAS status and exemption from total and added sugar labeling. Demand is also expanding in Asia-Pacific and Latin America, where consumer interest in low-glycemic, reduced-calorie alternatives is accelerating.
What makes allulose particularly attractive is its taste and functionality. It delivers approximately 70% of the sweetness of sugar with a clean flavor and no bitter or cooling aftertaste. Its performance in formulations — particularly baked goods, sauces, frozen desserts, and dairy applications — is exceptional due to its sugar-like texture, browning properties, and non-crystallizing nature.
That said, regulatory hurdles still exist in some regions. Allulose is currently classified as a “novel food” in the EU and remains restricted in Canada, limiting global adoption. Additionally, retailers such as Whole Foods in the U.S. have been cautious with widespread approval.
In summary, while allulose commands a premium price, it offers a strong return in formulation flexibility, taste performance, and consumer appeal. With regulatory momentum building and functional benefits hard to ignore, securing a reliable supply now will be key to managing cost exposure and capitalizing on future market expansion.
Xylitol
Import costs for xylitol are all over the board right now, typically ranging from $3 to $6 per kilogram for bulk orders. That spread depends on volume, purity, and where it’s coming from. If you’re sourcing premium raw material or working with smaller order quantities, you’re going to land closer to $5–$6/kg. Larger-volume or lower-purity shipments tend to fall between $3–$5/kg. That said, production itself is costly and not particularly efficient — most of it still comes out of China, where water usage is heavily taxed, and xylitol requires a lot of it. That drives up costs before it even hits the port.
The global xylitol market was valued between $1.0 and $1.4 billion in 2024, and projections show it climbing to as much as $2.3 billion by the early 2030s. We’re looking at a CAGR around 4–6%. The demand is real—food and beverage is leading the charge, but we’re also seeing growth in oral care, pharma, and personal care because of its dental benefits, low glycemic impact, and overall appeal as a natural sugar alternative.
Granulated xylitol is still the most common format, especially from sustainable sources like corn cobs and hardwoods like birch. North America remains a stronghold, but Asia-Pacific (particularly China and Southeast Asia) and Europe are catching up fast thanks to health-forward consumer trends and more favorable regulatory environments.
Functionally, xylitol hits a lot of marks. It’s roughly as sweet as sugar, delivers fewer calories, and offers oral health benefits that make it ideal for chewing gum, toothpaste, mints, and certain baked goods. It also holds up well in cold applications with great freezer stability and nice mouthfeel in reduced-sugar formats.
That said, it’s not without its quirks. It’s hygroscopic, so you can run into texture issues, clumping, and shelf-life concerns if storage isn’t dialed in. It can crystallize under the wrong conditions, and while it has less of a cooling effect than erythritol, that sensation is still present — and not always desirable. Solubility, melting point, and production efficiency can be inconsistent depending on how it’s processed. And like most polyols, it can cause GI distress at higher doses — more so than erythritol, in most cases.
Bottom line: xylitol is a valuable tool in the reduced-sugar toolbox, but it’s not plug-and-play. Understanding its behavior in your specific application is key to getting the performance and consumer experience you’re after.

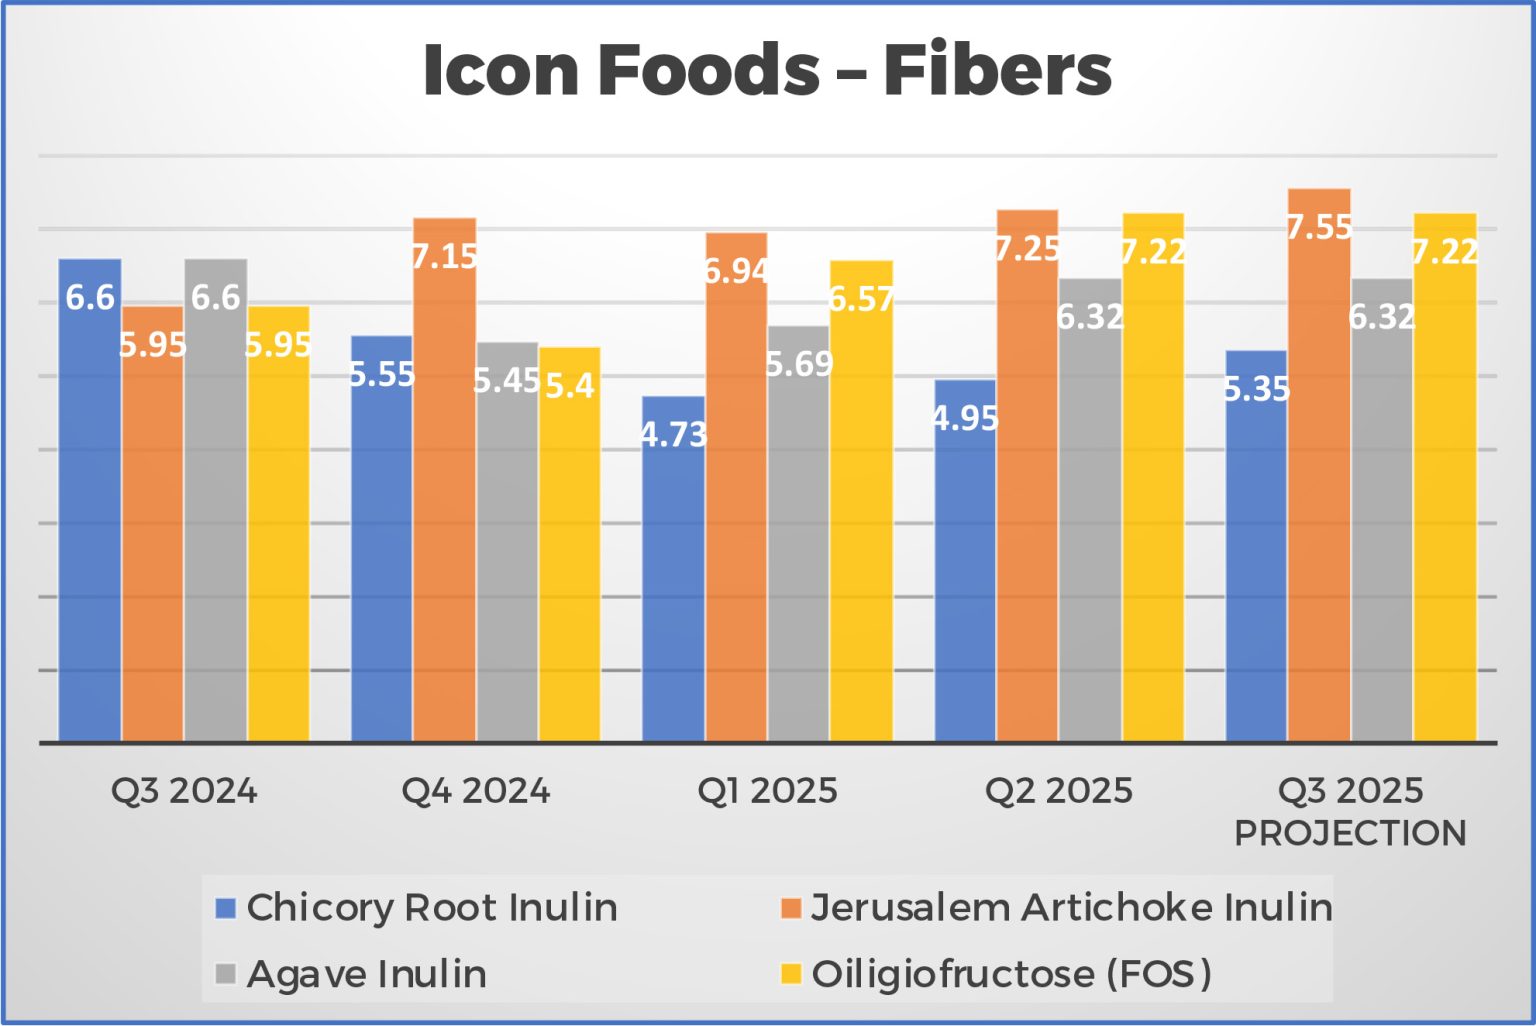
Inulin
Market costs for inulin are holding steady, depending on volume, source, and purity. While supply remains relatively stable, we’ve seen some upward pressure on pricing driven by growing demand and tight production expansion globally.
The inulin market itself is on a solid growth trajectory. In 2024, it was valued between $1.8 and $2.0 billion, with projections pushing that closer to $3.5 billion by the early 2030s. What’s driving that growth? Gut health awareness, clean-label reformulation, and increased use across categories, from food and beverage to supplements, infant formula, and even pharma.
Powdered inulin, especially from chicory root, agave, and Jerusalem artichoke, continues to lead. Both conventional and organic formats are in demand. Most of the pull is coming from functional food, but clinical nutrition and nutraceutical applications are gaining ground fast. North America and Europe are still strongholds, but we’re seeing increased adoption in Asia-Pacific as well.
From a formulation standpoint, inulin delivers solid functionality — fat mimicry, mild sweetness (~10–35% as sweet as sugar), and prebiotic benefits that support gut health. But it’s not without its challenges. It’s highly hygroscopic, which means clumping and shelf-life issues can creep in if storage isn’t dialed. You can also run into crystallization and glass transition stability problems, especially in baked goods or anything exposed to temperature swings. Solubility and texture can vary significantly depending on the chain length — short-chain and long-chain inulin behave very differently in application. And like most fibers, too much of it can lead to digestive discomfort if you’re not careful with usage rates.
Bottom line: inulin is a powerful tool in the clean-label toolbox, but it’s got to be handled with care. Storage, packaging, and proper formulation make all the difference in getting it to perform the way you need it to.
FOS
Fructooligosaccharides (FOS) doesn’t get the spotlight like inulin, but maybe it should. At Icon Foods, we’ve built a solid position with FOS because it offers something rare in today’s ingredient landscape: versatility, value, and agility.
While pricing remains favorable (especially compared to inulin), the real strategic win is in how FOS shows up on a label. If you’re marketing prebiotic fiber, FOS gives you the ability to pivot back and forth between inulin or FOS without needing to change your packaging. That kind of flexibility matters when supply chains tighten or specs shift. It’s the kind of move that keeps brands agile without compromising clean label claims.
Why It’s Moving
Yes, gut health is trending. Yes, FOS supports that narrative. But the real traction we’re seeing is behind the scenes with formulators looking for:
- Low-calorie sweetening with body and mouthfeel
- A subtle sweetness that doesn’t fight with flavor systems
- A clean, low-bloat alternative to sugar alcohols
It’s not just showing up in prebiotic sodas anymore — it’s in protein bars, nootropic gummies, hydration powders, and even early-stage infant formulations as a stand-in for HMOs.
The Bigger Picture
North America is leading demand, but Asia-Pacific is where the acceleration is happening not just because of gut health awareness, but because FOS checks multiple boxes: aging population, diabetic-friendly, and culturally aligned dietary patterns. Formulators in those markets are moving faster than brands here realize.
Market value projections are impressive, sure (FOS is expected to hit $4.45B by 2029, growing at 8.5% CAGR, source). But numbers don’t tell the whole story. What matters more is that FOS has reached a tipping point: it’s now a formulator-first ingredient, not just a marketing play.
Bottom line: FOS is about quiet leverage. It won’t get flashy headlines, but it gives you room to move — on cost, on label strategy, and on formulation. That’s the kind of ingredient you want in your corner right now.
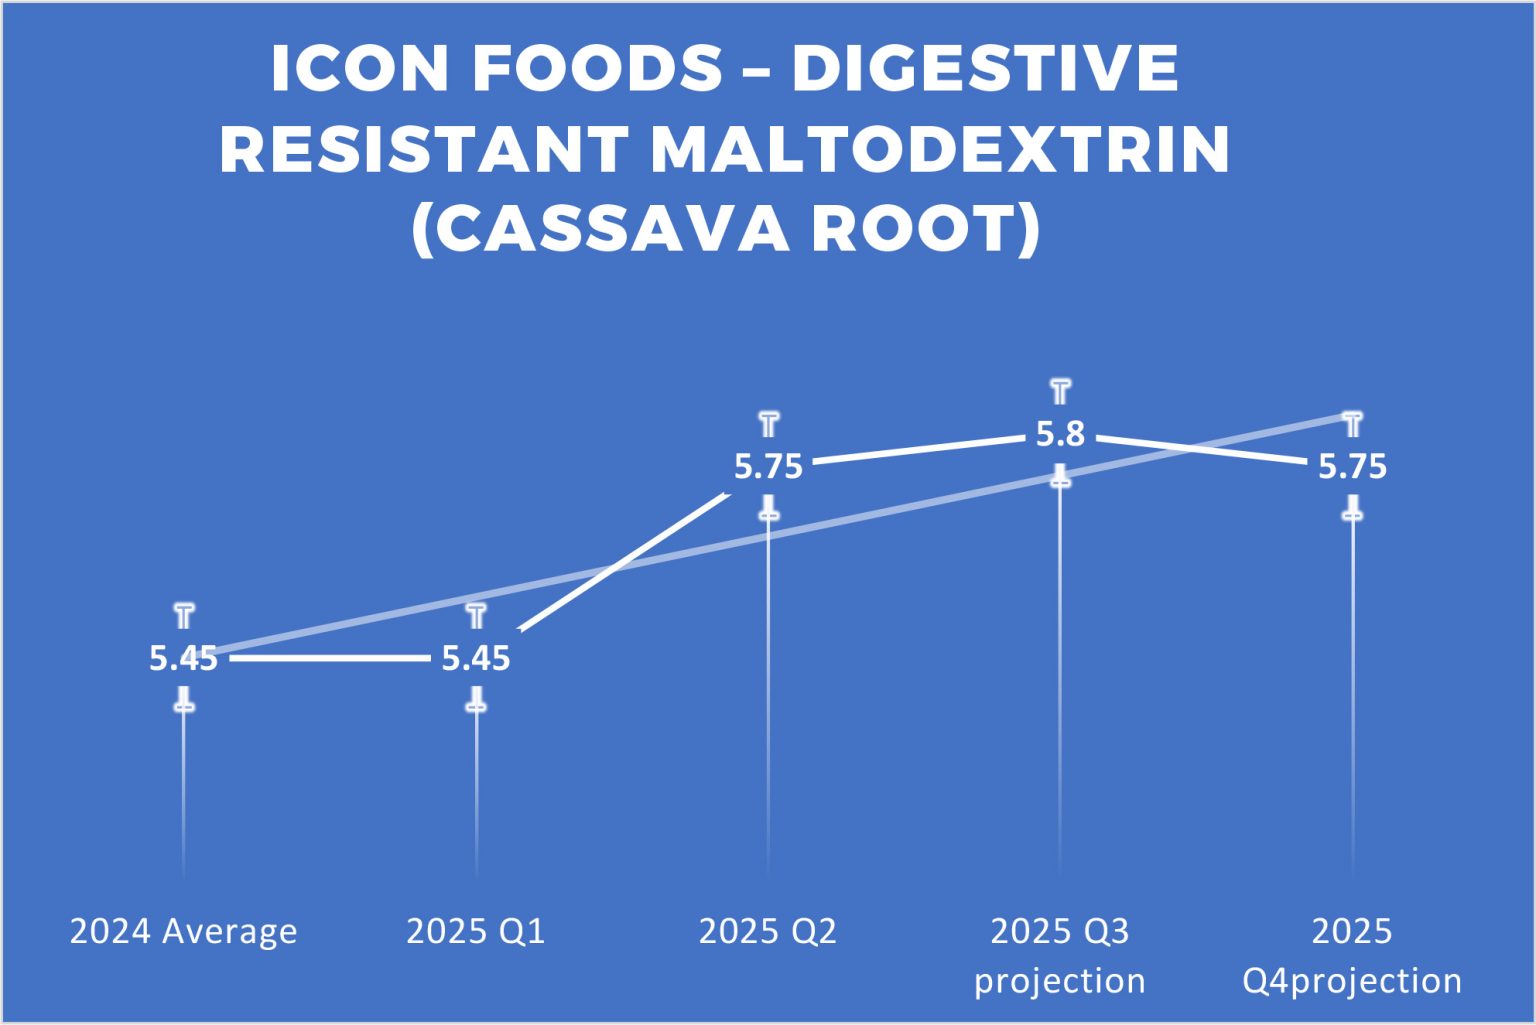
Soluble Tapioca Fiber
The soluble tapioca fiber market continues to gain momentum, fueled by rising consumer demand for functional ingredients that support gut health, satiety, and clean label formulations. As of 2023, the global market was valued at $13.25 billion, and it’s projected to nearly double — reaching $29.75 billion by 2032, with a CAGR of 9.2% during the forecast period.
One of the most notable trends is the growing adoption of soluble tapioca fiber in the beverage sector, especially within the “better-for-you” and gut health-forward categories. Whether it’s prebiotic sodas, high-protein shakes, or functional hydration drinks, soluble tapioca fiber is being leveraged for more than just nutritional value. It also enhances mouthfeel, improves texture, and contributes to cleaner labels.
At Icon Foods, we understand that formulation is only half the battle — sourcing is everything. That’s why we’ve taken a proactive approach: we do not primarily source our soluble tapioca fiber from China, which insulates our supply chain from volatility, geopolitical risk, and shifting tariffs. This allows us to offer reliable, high-quality fiber solutions that keep your innovation pipeline moving.
With demand growing and supply tightening, the time to secure your sourcing is now. If soluble tapioca fiber is part of your formulation strategy, or even on your radar, reach out to your Icon Foods representative. We’re here to ensure you stay ahead of the curve with consistent, compliant, and strategically sourced ingredients.
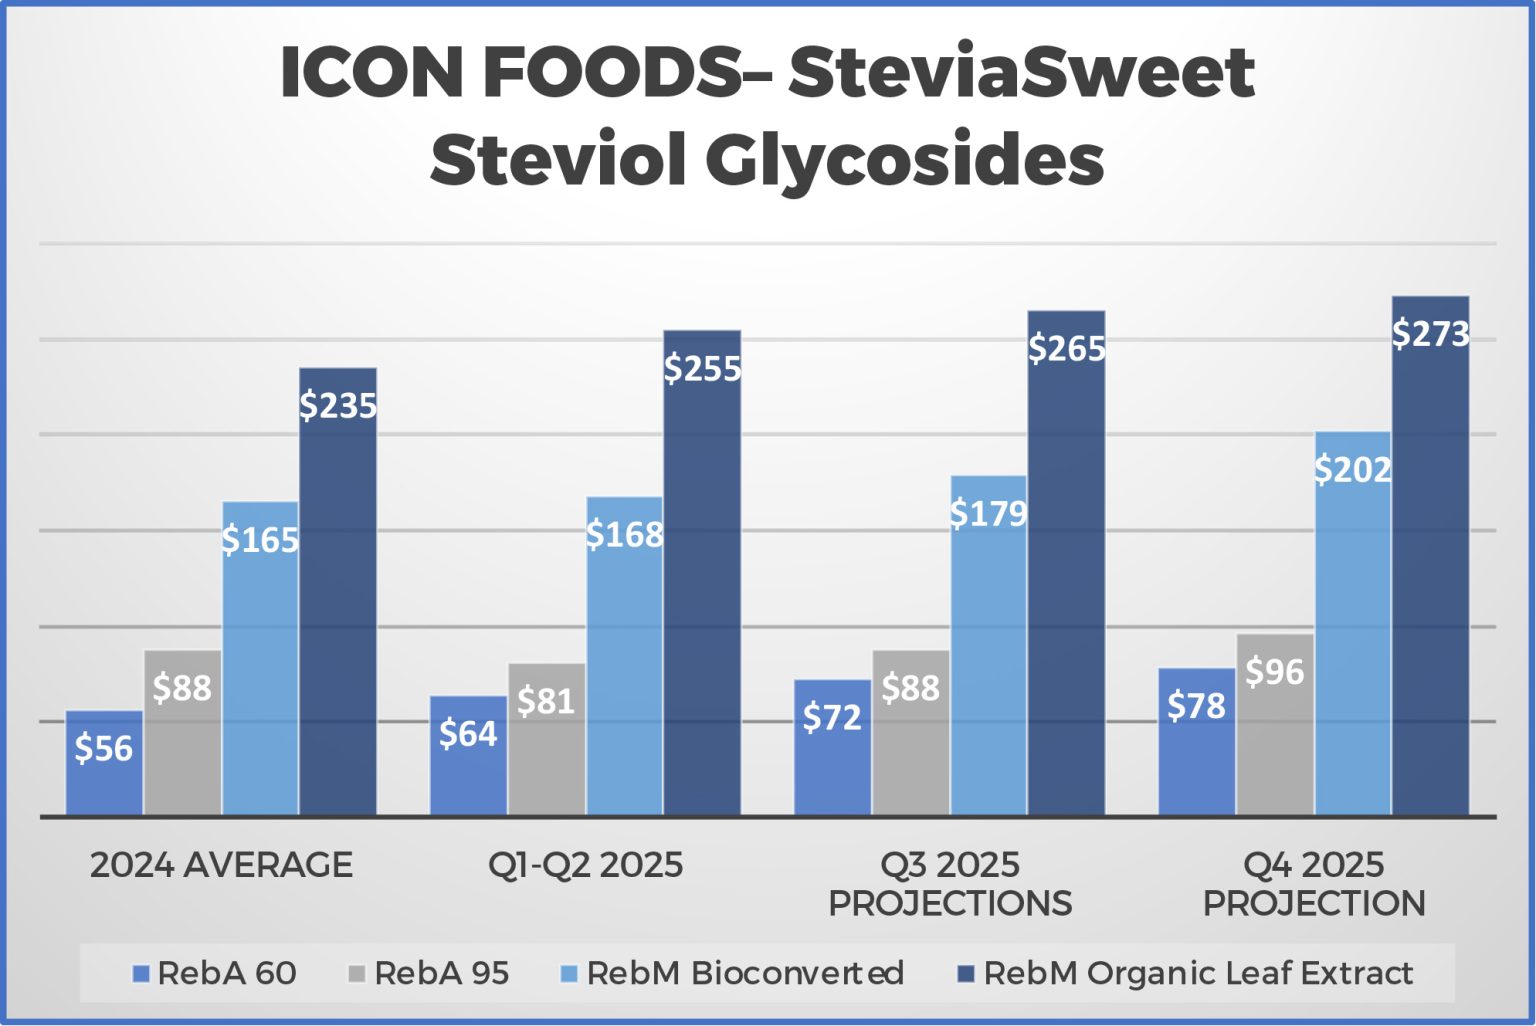
Stevia
The global stevia market continues to grow steadily, driven by strong consumer demand for natural, low-calorie sweeteners. Estimates put the 2025 market value between $0.93 and $1.03 billion, with a CAGR of around 10–12%, projecting growth to roughly $1.4–1.5 billion by 2030–2033. Some forecasts suggest the market could nearly double by 2032, reaching $2 billion at a similar growth rate.
A few trends are fueling this momentum. Asia-Pacific leads the charge, accounting for about 45% of global demand, followed by Europe and North America. The primary application sectors remain food and beverage; particularly powdered extracts used in low-calorie and reduced-sugar formulations. Rising health consciousness, stricter sugar regulations, the expanding diabetic and keto consumer base, and clean-label demand are all driving growth. That said, challenges remain around evolving regulatory landscapes, price competition, and variability in extraction and purity profiles.
Stevia remains a high-growth category, especially as brands innovate with glycoside blends to improve taste and minimize off-notes. Traditionally, stevia sweeteners have centered on Rebaudioside A (Reb A), which delivers high sweetness but often carries bitterness or licorice-like aftertastes. In contrast, newer glycosides like Rebaudioside M (Reb M) and Rebaudioside D (Reb D) are gaining traction for their cleaner, more sugar-like profiles. Reb M is especially valued for its smooth, rounded sweetness with minimal aftertaste, while Reb D complements it by adding depth and rounding out the sensory experience.
Icon is leaning into steviol glycoside blends. We love stevia, but we’ve found that each grade brings its own strengths and when combined, they can deliver a near-perfect solution depending on the application. At IFT First, we’ll be introducing our newest blend, designed to offer formulators the clean sweetness and flexibility they need to meet today’s demands for reduced sugar and clean label.
Icon’s new SteviaSweet RM95D blend combines Reb M and Reb D to deliver approximately 300 times the sweetness of sugar, with reduced bitterness and a smoother onset compared to Reb M or Reb D alone. This blend acts as a sweetness modulator, enabling formulators to reduce sucrose by up to 50% while preserving taste integrity and without needing additional flavor maskers. Offered in both conventional and organic forms, SteviaSweet RM95D works across a range of applications, including beverages, dairy, and confections, giving brands a flexible, clean-label solution to meet rising demand for better-for-you products.
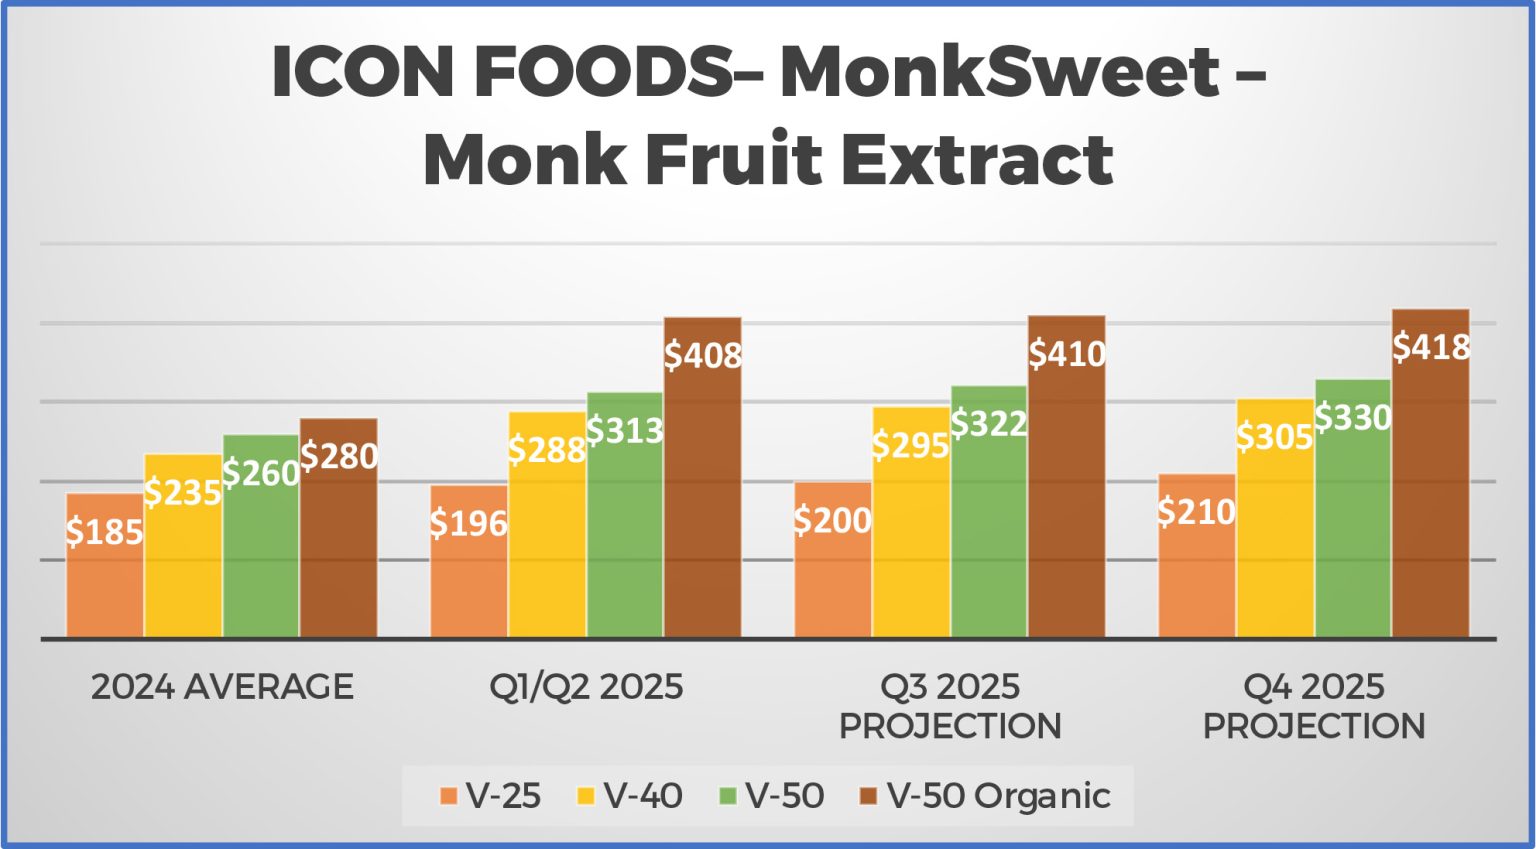
Monk Fruit
Monk fruit, being a zero-calorie, plant-based sweetener, is exploding in popularity as consumers ditch sugar and artificial alternatives in favor of clean-label, natural options. At 150–200 times sweeter than sugar without spiking blood sugar, it’s become a go-to for brands looking to meet the growing demand for healthier formulations.
The monk fruit sweetener market is booming. In North America alone, the category is tracking a 6.6% CAGR, driven by increasing consumer awareness and demand for low-calorie, non-GMO, and organic ingredients. And as brands continue to shift away from artificial sweeteners like aspartame and sucralose, monk fruit is firmly positioned as a clean-label favorite.
One important consideration that often gets overlooked? Monk fruit is a seasonal ingredient. It’s harvested once annually, typically in September or October. The months immediately following harvest are the most advantageous time to lock in pricing and secure volume. As the year progresses and inventory gets purchased, upward pressure builds on price. Historically, we start to see price creep by January or February, with peaks often hitting around August, just before the next harvest begins.
Compounding the challenge, the majority of global monk fruit production is concentrated in China, making the supply chain sensitive to tariffs, geopolitical dynamics, and limited harvest windows. This creates a narrow window of opportunity for brands to lock in competitive pricing and reliable supply.
As sugar reduction continues to dominate R&D priorities across food and beverage, monk fruit’s role in clean-label formulation will only expand. The brands that win will be the ones that secure their supply proactively, align with stable sourcing partners, and anticipate market shifts before they hit.
Cocoa
Cocoa pricing continues to be one of the most volatile segments in the global commodity market. After historic price surges earlier this year — driven by poor weather conditions in West Africa, aging crops, and disease pressure from black pod and swollen shoot virus — many large manufacturers turned to trade relief in hopes of easing the financial burden. Companies like Hershey, Mars, Mondelez, and Nestlé pushed for broad tariff exemptions on cocoa and cocoa-derived ingredients, particularly during the U.S. administration’s temporary 90-day tariff pause.
However, those efforts have largely failed. Despite significant industry lobbying, cocoa and cocoa derivatives did not receive exemption status under the tariff relief framework, keeping the pressure on manufacturers already battling record commodity prices. According to the International Cocoa Organization (ICCO), cocoa prices surged past $10,000/ton in early 2025 — nearly triple the average price in 2023 (https://www.icco.org/statistics/monthly-review/).
As a result, pricing volatility continues to ripple through the entire value chain from processors to CPG brands, especially those heavily reliant on chocolate, cocoa powder, and cocoa butter. The Financial Times recently reported that global chocolate giants are being forced to cut volume, reformulate, or pass on costs to consumers as the cocoa crisis escalates (https://www.ft.com/content/308826ad-f4cc-4fae-bbeb-d4fd180d2bc9).
Compounding the issue is the ongoing lack of tariff relief. The Office of the U.S. Trade Representative (USTR) has not granted broad exemptions on cocoa imports, and manufacturers must still absorb baseline tariffs and logistics costs in a high-demand, short-supply environment (https://comments.ustr.gov/).
With continued crop failures in Ivory Coast and Ghana, which together supply more than 60% of the world’s cocoa, there’s no clear short-term resolution in sight. Most forecasts suggest elevated prices will persist through late 2025, especially if El Niño weather patterns continue to disrupt growing seasons.
For brands and manufacturers, the strategy now is risk management: diversifying supply chains, locking in strategic contracts, exploring alternative sweeteners or flavor profiles, and preparing for continued cost pressure. Until meaningful supply relief or tariff reform materializes, cocoa remains a high-risk, high-cost ingredient in a market defined by instability.
“In a slower-growth economy, ingredient partners who offer cost stability and clean label functionality will define who wins shelf space.”
Final Takeaway: The Rules Are Changing — Are You Playing to Win?
The big theme this quarter? Uncertainty is the new constant, but for those who are prepared, it doesn’t have to be paralyzing. From tariff shifts and freight volatility to the FDA’s crackdown on synthetic dyes and the ripple effects of macroeconomic drag, the food and beverage industry is in a period of realignment. Innovation isn’t gone — it’s just being recalibrated through a more practical, ROI-driven lens.
What we’re seeing is a market that’s demanding more from every input: more functionality, more flexibility, more accountability. Whether it’s erythritol impacted by Cargill’s AD/CVD petition, xylitol’s volatile pricing, or the expanding footprint of ingredients like allulose, inulin, and FOS — strategic sourcing and agile formulation have never been more critical.
Retailers are tightening the gate. Consumers are watching every dollar. And manufacturers are being pushed to do more with less, without sacrificing taste, label claims, or shelf performance. The companies that thrive won’t be the ones chasing every trend — they’ll be the ones who stay disciplined, who understand the levers they can pull, and who surround themselves with partners who aren’t just selling ingredients but helping build real solutions.
At Icon Foods, this is where we show up strongest. We’re not just here to keep you informed, we’re here to keep you moving. Whether you’re navigating tariff fallout, planning reformulations ahead of synthetic dye bans, or trying to forecast your next fiber blend or sweetener system, we’re committed to being in the trenches with you. With transparency, reliability, and a forward-leaning strategy that’s rooted in both market data and real-world application.
Thank you for trusting us as your partner. Let’s keep solving hard problems together. Thank you for your continued support.
Contact us!
Disclaimer
The opinions expressed in this newsletter are solely those of Icon Foods and do not necessarily represent the views of any affiliated parties. While we make every effort to ensure that the information provided is accurate and current, we cannot guarantee its completeness or reliability. Icon Foods is not responsible for any inaccuracies, errors, or omissions contained herein, nor for any consequences that may result from the use of this information. Readers are encouraged to conduct their own research and verification before making decisions based on the content provided.