Sweeteners and Fibers Look Out!
Good afternoon fellow food manufacturers, formulators, and enthusiasts of Clean Label Sugar Reduction. You know, in the past, we’ve seen our fair share of challenges and disruptions in the supply chain. But guess what? Things are looking good for most ingredients and inputs—or at least stable. I’ll take it.
One of the biggest reasons for this shift is the resilience and adaptability of the food industry. Manufacturers, distributors, and suppliers have come together to keep the wheels turning and ensure that there are plenty of food ingredients at albeit elevated—but not insane—prices.
Moreover, the efficiency of the supply chain has improved significantly. Thanks to advancements in transportation, logistics, and technology, the process of getting ingredients from farm to factory has become faster and smoother.
Let’s not ignore the silver lining of all this: with supply chain disruptions came opportunities for innovation. Some of us found new and creative ways to get ingredients where they needed to go—whether that meant rethinking our production processes or finding new suppliers. In the words of Jocko Willink, “Good! You will always find a little bit of good in any challenging situation.”
The food ingredients supply chain is a complex and ever-evolving system that plays a huge role in food manufacturing. It drives profits and sometimes losses. At Icon Foods, there is a whole world of logistics and innovation happening behind the scenes to make it all function. I know I have come out of the past couple years with a newfound appreciation for the humble shipping container.
Corn
Right now, the case for corn prices looks bearish, with USDA estimating 2.221 bb of U.S. ending corn stocks in 2023-24—the most in seven years (6). Brazil is also wrapping up record corn production. Since last year, they’ve largely elbowed the U.S. out of the export market. Corn’s USDA estimates, however, are based on a lot of assumptions.
Recently, U.S. corn export sales have picked up. Total commitments for the new 2023-24 season are up 9% from a year ago, largely thanks to Mexico. Fortunately, U.S. corn will go to Mexico by rail and won’t depend on the dry Mississippi River, where barge traffic is restricted again this fall.
One thing this season has in common with 2020 is the extreme shot of hot and dry weather at the end of the season. There was no August derecho in 2023, but corn and soybean crop conditions, especially in the western Midwest, were dry from mid-August to roughly mid-September—a tough stretch for corn cobs and bean pods trying to fill out with little soil moisture to draw upon.
USDA’s crop estimates in the Oct. 12 World Agricultural Supply and Demand Estimates (WASDE) report should get us closer to the final numbers (10). Harvest evidence will be even more available in the Nov. 9 report. We can—and probably will—keep arguing about corn’s production estimate long after harvest; however, I’m more concerned about the unknowns of the new season ahead.
Brazil is now planting its first corn crop for 2024. Who knows how that crop will turn out? We can’t guess ourselves into an uncertain future, but we can pay attention to what prices are trying to communicate today. Right now, corn’s inclination to trade lower does not agree with the market’s bearish sentiment. Thursday’s new one-month high is a strong argument for corn’s future price. The fact that specs are so short and have already been wrong three times this year only adds to the bullish case for corn prices.
There are always a lot of factors that can impact the price of corn futures. Weather patterns, global political unrest, and changes in demand can all play a role in determining whether we’ll see prices rise or fall. But for now, things are looking pretty stable.
One minor word of caution: the 2024 yield will be smaller, and the market is bound to contract. This will impact corn derivative prices for many ingredients—allulose and erythritol being two of them. We will see the price turn up in May 2024. This is my anecdotal opinion—I have been around the sun quite a few times and have been to this rodeo before.
Logistics
Transportation prices 43.5 (index) fell again in September but the rate of decline has improved from the record pace set in May. The data set was down just 1 percentage point year over year (y/y) during the month. Downstream companies closer to the consumer (retailers), returned a neutral pricing reading of 50 compared to a 39.7 reading from upstream companies (wholesalers and manufacturers).
The survey of supply chain executives is a diffusion index. A reading above 50 indicates expansion while one below 50 signals contraction as opposed to any other index which usually uses 100 as a baseline.
The transportation pricing subindex stood at 46.8 during the last two weeks of September compared to a 38.5 reading in the first half of the month. When asked to peg transportation rates one year from now, respondents returned a reading of 69.4 (5).
If you translate the index into percentages, the drop is around 6.5%
Another thing I’m keeping an eye on is logistics and warehousing construction. Like housing starts, they are getting crushed by these outrageous interest rates. Check out this graph (8).
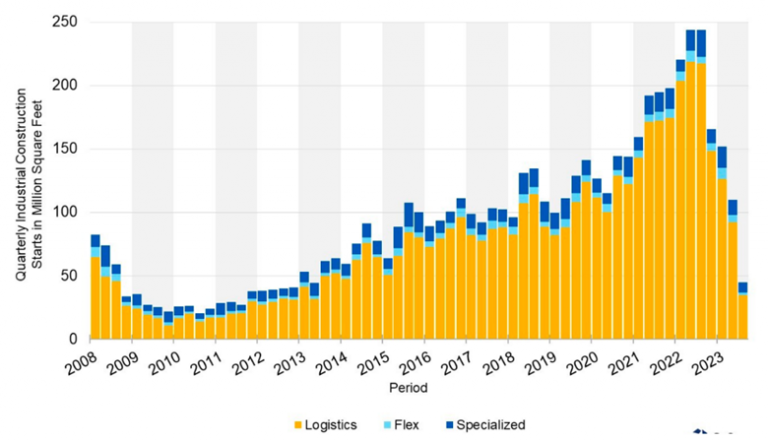
“This declining trend is expected to continue until the latter half of 2024 and into 2025” (8).
This is a supply and demand issue unfolding before our very eyes. As warehouse space tightens, upward pressure on pricing will occur and this will trickle down to ingredient storage—particularly third-party logistics companies that hold material for us ingredient suppliers. This may put upward pressure on pricing as well. Translated into real world numbers, maybe a few dollars per metric ton. Not earth shattering, but something to consider.
Tariffs
Can you believe we are approaching 2024 and another election cycle? That’s how long we’ve been stuck with the Trump era tariffs on China.
The current administration has upheld these tariffs. Since we are going into an election year, and political tensions are high between the US and China, I would be very surprised if anything happened with the tariffs (4). Looking soft on China could cost Biden the 2024 presidential election, since anti-China sentiment in the U.S. has been high in recent years. The take home is this: optics on sunsetting the tariffs might look bad, but the $40 billion that it would put back into the economy might land well too (2).
Erythritol
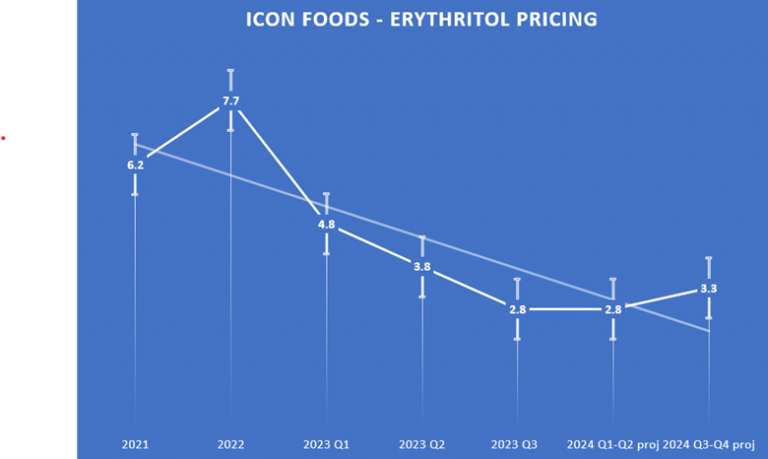
Remember back in February when we all had the crap scared out of us because erythritol had be implicated in major adverse cardiovascular events (MACE)? Folks couldn’t unload that stuff fast enough. My suggestion was to pump the brakes and take a few deep breaths. Lo and behold, unit volume only dropped by .29%. That’s right, a little more than a quarter percent. The price has plummeted. This is the first time in my 22 years in the industry that I have seen erythritol coming in cheaper than cane sugar and fructose. However, the low price caused by high supply will start to diminish in late Q1 of 2024. I would get whilst the getting is good. Lock your positions in through 2024 if you can.
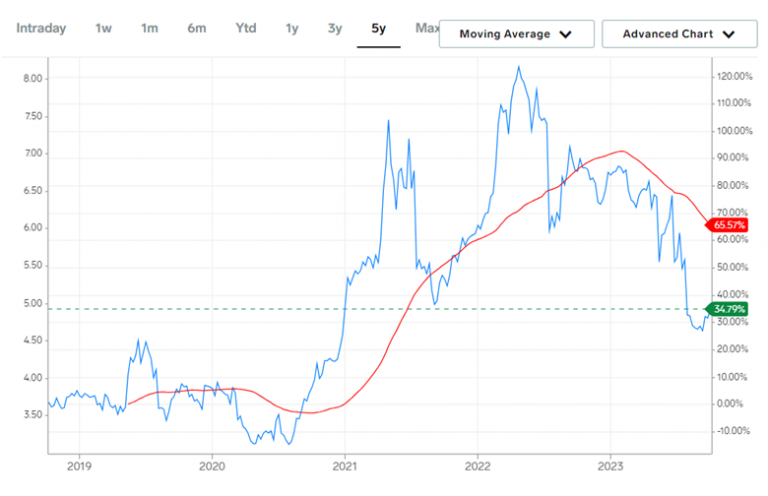
“About cane sugar, according to U.S. Department of Agriculture data, the global price of white refined sugar was 32 cents per pound in September, a 35% year-over-year increase from 24 cents last year” (1). Bad news for the purveyors of poison, but good news for the alternative sweetener category as more CPG’s find the low cost of erythritol attractive.
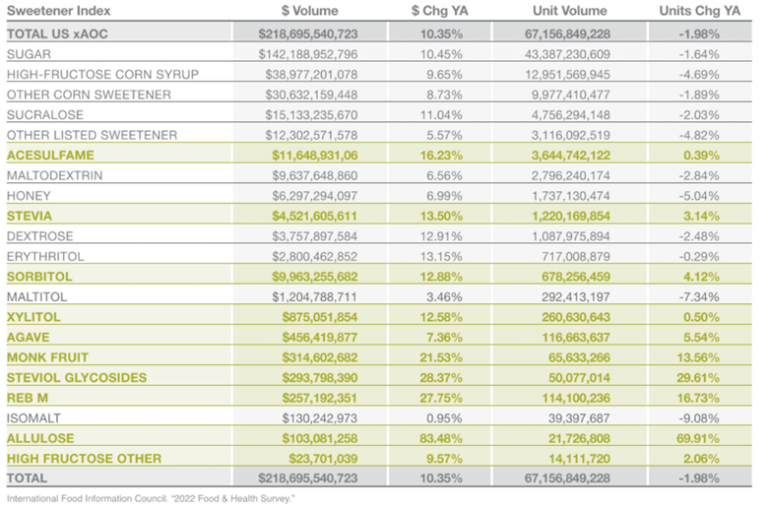
When viewed by dollar volume, sales numbers for sweeteners grew over the past year due to pricing increases, while the unit volumes sold for sugar, high fructose corn syrup, and other corn sweeteners decreased. The volume of sugar units sold dropped off by 1.64%; high fructose corn syrup dropped by 4.69%; other corn sweeteners dropped by 1.89%. Products made with acesulfame potassium (Ace-K) grew by a whopping 16.2% by dollar volume, while unit sales remained flat. Honey is the top nature-derived sweetener—followed by stevia—with $4.5 billion in sales by volume, which is up 13.5% over the previous year (3). Stevia’s unit sales also grew by 3.14% over the past year, while honey unit sales dropped by 5.04%. Over a 10-year period, global product launches using stevia grew by 27% (7). Products using stevia made up $4.2 billion in retail sales in 2021 across all food and beverage categories, growing at a rate of 15% over a five-year period (2016–2021) (7). Products made with stevia outperform their respective categories: growth rates of products containing stevia were two to five times greater than the rest of the products in their category (7).
Consumers are taking note of other alternative sweeteners, too. Though still only representing a small base, allulose and monk fruit sales shot up by 69.91% and 13.56% respectively.
As we see the corn market start to contract and all of the surplus material start to dry up, upward movement on price and tightening of supply will happen. My prediction is May 2024 at the latest.
Call your Icon Foods representative and help us help you get your erythritol needs locked down through 2024.
Allulose
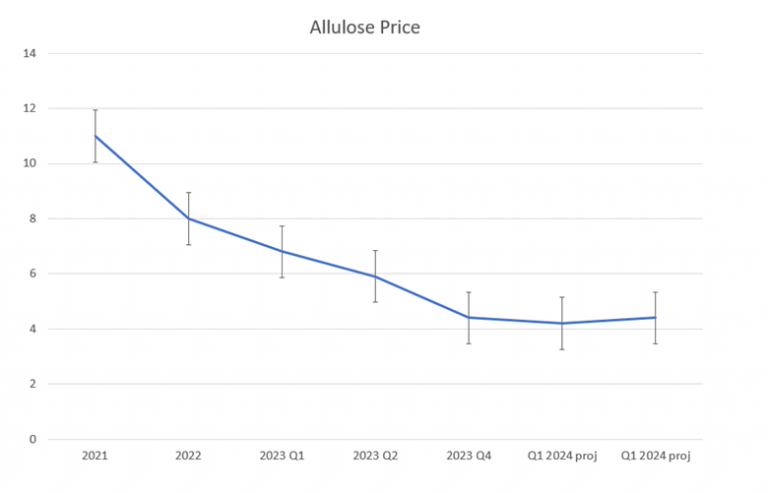
There were several new high-quality producers of crystalline allulose that started scaling in 2022, resulting in move product in the market in 2023. This created downward pressure on pricing. Prices went down about 10% over the last quarter. While the price of allulose syrup remains stable, crystalline allulose still has a way to go. With time, pricing will go down as more product enters the market.
I get asked a lot, “what’s the deal with crystalline allulose?” Here’s the medium-long version. Unlike erythritol, allulose requires a traditional crystallization process. Manufactures use a broth of liquid allulose to create a super saturated environment the triggers crystallization—similar to a middle school experiment in which sugar water and a string develop rock candy. Each crystallization process is a separate intellectual property. The university of Japan, Tokyo holds the original patent. Additionally, the conversion from glucose or starch is not very efficient. There are a couple of companies that have developed technology to speed that process up, but that is a few years off. I have been told that this technology will bring the price down below the cost of fructose. That would be amazing.
Allulose is one of the best non-nutritive sweeteners in my opinion. It is easy to formulate with and plays very well with other sweeteners and fibers. However, it remains a little pricey. With consumers tightening their belts, keeping your COGS low should be a priority. Using monk fruit and/or stevia with allulose will save you money and allow you to stretch the allulose further. If you need help with the conversion, Icon Foods is ready to assist.
Xylitol
Xylitol prices have been coming down and are stabilized. We get a lot of questions about why xylitol is so expensive. It comes down to water and power—a lot of water and a lot of power is required to get the d-xylose out of the corn cobs and corn by products. China also has a heavy tax on water usage and expensive electricity. The majority of xylitol is derived from corn cobs that do not birch as some people have been led to believe. Since xylitol is a corn derived ingredient, its cost will rise with the price of corn and when availability wains. This would be an ingredient worthy of hedging right now since polyols across the board are at historic lows.
Inulin
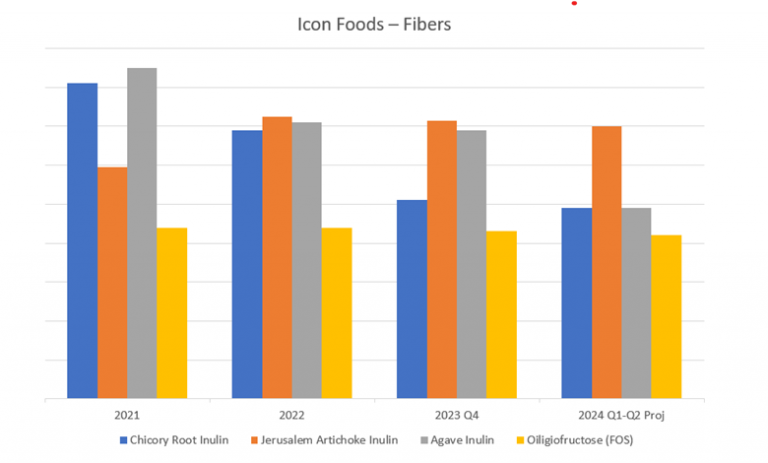
The chicory root inulin supply chain is quite solid; pricing is stable and even down some since a lot of manufactures moved from chicory root inulin to FOS when the price was sky high and supply chains were non-existent. Jerusalem artichoke and agave inulin are certainly stable, but somewhat pricey. It appears the abundance of chicory root inulin is putting downward pressure on the other inulin type fibers, but this may turn soon, at least with agave inulin.
While FOS may not have the jelling properties of chicory, Jerusalem artichoke, or agave—mostly because of chain length—FOS still holds up well in most processes, dissolves quickly with little turbidity, and is a fantastic prebiotic fiber. Stacking FOS with other inulin type fibers and soluble tapioca fiber will pack more fiber into your formula, give you excellent gelling, and stabilize whatever potential gastro-intestinal effects that may occur from too much dietary fiber.
FOS
Most of what I needed to say about FOS is in the inulin paragraph. Icon Foods is well stocked and well positioned with FOS. The price is very good and can save manufactures money compared to inulin. One of the best value propositions of FOS is labeling. It shows up well on the NFP, but also gives you flexibility on the ingredient statement. When called out as prebiotic fiber or even FOS, you can alternate between inulin and FOS in your formula without having to change all your packaging. Food for thought when considering your fibers.
Soluble Tapioca Fiber
From an Icon Food prospective, soluble tapioca fiber is the gold standard for fiber. The price will not be driven up by the corn market. It is not manufactured in China, thus not subject to the 25% tariff. Functionally, it’s an RS4 resistant dextrose or resistant starch that works well in keto & low-carb products and in applications where fiber is needed to contribute to mouthfeel. Icon Foods is very well positioned in soluble tapioca fiber. The price is much lower than soluble corn fiber and you won’t have to put “corn” in your ingredient dec. As I mentioned, this is the gold standard—many beverage companies and food manufacturers are migrating over to soluble tapioca fiber. I would look for supply to contract starting late Q4 of this year to avoid upward pressure on cost in Q1- Q2 2024. This will be especially important if there is extreme weather in Southeast Asia. Cassava Root, which tapioca is derived from, is susceptible to extremes. If crops crash, shortages and price increases can happen very quickly. Lock in for price stability.
Stevia
China produces over 80% of stevia extract distributed around the world—having a finger on the pulse of this sweet commodity can really help with predictive analysis when it comes to pricing.
Last month was the glorious harvest time for stevia leaf. Agricultural teams (Syngenta) are actively working with farmers to harvest this year’s banner crop.
As opposed to 2022, the 2023 planting area of stevia this year has increased by 30% – 40%. More planting area, more plants.
Stevia is mostly grown from clippings. The ratio of seedlings to seed crops is 95% to 5%. Clippings enable the plant to leverage specific glycosides, like Reb M. This has contributed to a significant price drop in Reb M when compared to the initial price of the glycoside when it was first isolated and commercialized. The price will continue to decrease with efficiency.
Chinese farmers are seeing higher returns with competitive crops such as corn, peppers, and onions. This presents competition for field space, which can affect yields of stevia leaves. Since the harvest occurs in September, the bounty of extract will likely start showing up in early November.
Bioconversion and enzymatic processes will fill a lot of the gaps and apply downward pressure on pricing. However, if your need is organic leaf extract, the prudent buyer would lock their positions in through 2024. While prices may rise over the next few months, never fear. Like all things in this world, it will be temporary. Look for a pullback in the late second quarter of 2024.
Monk Fruit
After a significant spike in price in 2022 followed by stabilization in Q2 of 2023, Q2 of 2024 looks to be a triggering a buy sign. Over the next 4-5 months, monk fruit prices will stay stable and maybe pull back about 3-5%. June or July is when we’ll start to see up to 20% downward pressure on pricing. Why, you ask? There was a record harvest this year. Of course, there is a selloff of 2022-23 material that is putting some nice downward pressure on pricing as suppliers try to churn remaining stocks. Prices are stable right now and coming down. You probably have until the end of July to scoop up some serious deals. I would stock up.
Summary
Look, I know the market updates have been a bit menacing in the past. This one could be among the most boring reports I’ve written since I started doing these. In this case, boring is good. I almost fell asleep a few times writing this, but don’t we all need a little more rest—or at least, peace of mind?
Thank all of you for your kind comments regarding my last market intelligence report. That means a lot but, what would mean even more is if you told me what I can do better and how Icon Foods and I can be a resource for you.
Thank you for your continued support.
Thom
Sources
- Casey, Chris. “Sugar Shortage Isn’t Causing Spike in Halloween Candy Prices: Wells Fargo Analyst.” Supply Chain Dive, 24 Oct. 2023, www.supplychaindive.com/news/sugar-shortage-isnt-causing-spike-in-halloween-candy-prices-wells-fargo-a/697548/.
- Donnan, Shawn, and Jordan Yadoo. “US-China Trade War Cost Tops $40 Billion in Lost U.S. Exports.” Com, Bloomberg, 28 Feb. 2019, www.bloomberg.com/news/articles/2019-02-28/china-trade-war-cost-tops-40-billion-in-lost-u-s-exports#xj4y7vzkg.
- Food Insight. “2023 Food and Health Survey.” Food Insight, 9 Apr. 2023, foodinsight.org/2022-food-and-health-survey/.
- Gura, David. “How High Tensions between China and the U.S. Are Impacting American Companies.” NPR, NPR, 26 Aug. 2023, www.npr.org/2023/08/26/1195711197/china-us-trade-tensions-commerce-secretary-gina-raimondo.
- Maiden, Todd. “Declines in Transportation Prices Slow Again in September.” FreightWaves, 3 Oct. 2023, www.freightwaves.com/news/declines-in-transportation-prices-slow-again-in-september#:~:text=Transportation%20prices%20(43.5)%20fell%20again,%2Fy)%20during%20the%20month.
- “USDA Increases Corn Production, Lowers Yield.” DTN Progressive Farmer, 12 Sept. 2023, www.dtnpf.com/agriculture/web/ag/news/article/2023/09/12/usda-releases-september-crop-wasde-2#:~:text=Production%20for%20the%202023%2D24%20corn%20crop%20was%20increased%20to,19%20mb%20to%202.221%20bb.
- Shoup, Mary Ellen. “IFT First: Consumers Prioritize Sugar Content over Sweetener Type, Says Cargill.” FoodNavigator USA, William Reed Ltd, 21 July 2022, www.foodnavigator-usa.com/Article/2022/07/21/ift-first-consumers-prioritize-sugar-content-first-then-sweetener-type-says-cargill#.
- Sidharth, Rachayita. “US Logistics and Warehousing Construction Hits Decade Low as Interest Rates Rise.” Logistics Insider, 5 Oct. 2023, www.logisticsinsider.in/us-logistics-and-warehousing-construction-hits-decade-low-as-interest-rates-rise/.
- “Sugar and Sweeteners Yearbook Tables.” Economic Research Service , U.S. DEPARTMENT OF AGRICULTURE, www.ers.usda.gov/data-products/sugar-and-sweeteners-yearbook-tables/. Accessed 9 Nov. 2023.
- WASDE Report, U.S. DEPARTMENT OF AGRICULTURE, 12 Oct. 2023, www.usda.gov/oce/commodity/wasde.