Summary
Icon Foods CEO Kash Rocheleau’s Q4 Market Intelligence Report underscores a pivotal moment for the food and beverage industry. As tariff volatility, ocean freight surges, and regulatory scrutiny reshape supply chains, brands are being challenged to adapt faster than ever. The report explores how macroeconomic shifts—from Fed rate cuts to GLP-1-driven changes in consumer spending—are transforming the ingredient landscape, pushing innovation to do more with less. Key insights include the ripple effects of ongoing erythritol trade cases, record U.S. corn yields, and the rise of fibers like inulin, FOS, and soluble tapioca fiber as functional powerhouses. Through it all, Rocheleau’s message is clear: success in Q4 and beyond means playing offense—planning ahead, reformulating early, and partnering strategically to stay ahead of the curve.
authored by
Kash Rocheleau
Chief Executive Officer, Icon Foods
As we head into Q4, there’s plenty to discuss—but first, I want to thank you: our readers, customers, innovators, formulators, purchasers, and supporters. Your thoughtful feedback, continued interest, and loyalty—both to these Market Intelligence Reports and everything in between—mean a great deal to us.
This quarter’s report will highlight what we see on the horizon: tariff implications, updates from HHS, and regulatory proposals, as well as insights into what consumers are truly seeking.
We create these reports for you, so if there’s a topic, you’d like us to cover in future editions, please share your feedback.
If you’re going to be at Supply Side West, stop by our booth. We’ll be showcasing some new tools to help you stay ahead of both formulation and supply chain curveballs.
In the meantime, we hope you enjoy what we’ve put together for this quarter.
Let’s dig in!
Tarrifs
The Congressional Research Service report “Presidential 2025 Tariff Actions: Timeline and Status (R48549)” outlines a series of tariff measures implemented or proposed since January 20, 2025, under authorities such as the International Emergency Economic Powers Act (IEEPA) and Section 232 of the Trade Expansion Act of 1962. These actions have targeted goods from several major trading partners, including China, Mexico, and Canada. While some tariffs are already in effect, others remain under investigation. Sectors currently under review include semiconductors, pharmaceuticals, critical minerals, aircraft, heavy trucks, and timber, all of which could face further tariffs if determinations proceed. At the same time, the U.S. has been engaged in negotiations with countries such as the UK and the EU to reduce or modify trade measures; however, talks with others, including Canada and India, have not progressed. In response, many trading partners have already imposed retaliatory tariffs on U.S. exports.
Notably, the President has extended the temporary tariff reduction on goods from China, scaling rates down from 125% to 10%, through November 10. The Administration has also set a 15% ceiling on tariffs applied to goods from the EU, with exemptions granted for specific natural resources that are not available domestically. These developments highlight the fluidity of tariff policy, where shifts in rate structures can significantly impact sourcing strategies, landed costs, and competitive positioning across industries.
The report further emphasizes that many tariffs are cumulative, meaning new duties are layered on top of existing ones, raising costs and adding complexity for importers. This has created a climate of uncertainty and volatility, as ongoing investigations and negotiations make it difficult for businesses to forecast landed costs or plan their supply chains. Exporters are also exposed to new challenges as foreign governments respond with countermeasures, which could reduce demand for U.S. goods or increase costs abroad.
Retaliatory tariffs are particularly important to monitor due to their ripple effects on agricultural commodities. The United States produces more corn than any other country (around 31% of global production annually) and exports 15–20% of that crop, primarily to Mexico, China, and Japan. If U.S. corn exports to China are met with retaliatory tariffs, that raw input becomes more expensive. When that corn is then used to manufacture erythritol in China and re-imported into the United States, the added cost is embedded in the price of the finished ingredient. These dynamic underscores the reality that the exporting country does not truly pay tariffs but instead act as a passive tax ultimately passed down to consumers.
Certain industries, most notably the automotive and parts sector, critical minerals, semiconductors, and aerospace, are particularly vulnerable to these developments and may face heightened compliance demands, increased costs, or supply disruptions. The report also underscores the growing importance of trade certifications and country-of-origin documentation. As tariff rates diverge by origin, companies must be more attentive to sourcing decisions and certifications such as those under USMCA. For many firms, the direction of tariff policy will shape not only immediate cost structures but also longer-term sourcing strategies, competitiveness, and market positioning.
At Icon Foods, our pricing reflects the true landed cost of materials. We pride ourselves on transparency and integrity, passing along only the fees we incur. If tariffs are reduced or come in lower than expected, we automatically adjust your pricing accordingly—no need to ask. We will also continue to closely monitor this topic so that we can serve as a resource to you and your planning and purchasing teams.
Ocean Freight
The recent tariff ceasefire has had an immediate impact on supply chains, driving a surge of container traffic through the Port of Long Beach. In fact, the port just recorded its second-busiest August and sixth-busiest month in its 114-year history (Tariff ceasefire powers Long Beach container surge – FreightWaves). Importers are clearly moving fast to get product in under reduced duties, anticipating that tariffs could snap back at any moment. At the same time, improving prospects out of China are pushing ocean freight rates higher, with demand firming up and carriers able to command more for capacity. This underscores just how sensitive ocean freight is to policy shifts and how one announcement can send volumes spiking and rates climbing almost overnight.
For anyone moving heavy or high-volume goods, this volatility directly impacts landed costs. Port congestion, delays, and added surcharges are now part of the equation, and those don’t just raise freight bills—they stretch lead times and throw off planning. We’ve all seen how quickly demurrage, dwell time, and trucking shortages can accumulate when containers flood into a port simultaneously.
That’s why timing and strategy matter more than ever. Whether it’s building some buffer stock, locking in rates with carriers ahead of anticipated hikes, or simply watching the data coming out of China and U.S. ports more closely, the companies that stay agile will have the edge. At Icon Foods, we track these developments daily, because every dollar added to ocean freight shows up in the cost of your inputs—and we want to help you plan for it, not be blindsided by it.
For your planning and purchasing teams, this means forecasting for potential spikes, securing rate stability where possible, and keeping buffers for both cost and timing. Every shift in rates is a risk to the cost of your ingredients, and ultimately your finished goods. This is where strong partnerships with supply chain providers make all the difference. When planning is proactive instead of reactive, rate spikes and port congestion are far less disruptive, allowing us to navigate volatility with confidence and keep your supply chain moving smoothly.
Make Children Healthy Again
The MAHA report makes it clear: what and how much kids eat has tipped hard toward ultra-processed foods (UPFs). We’re talking packaged, shelf-stable, engineered for taste, convenience, and long shelf life — not nutrition. The report states that nearly 70% of an American child’s calories today come from ultra-processed foods, up from nearly zero in the 1960s. That’s not just a statistic, but it’s a signal of how deeply the food environment has shifted. What does this mean in practice for the food industry? For one, the dominance of UPFs has been driven not only by consumer demand for convenience but also by the structure of food systems, which includes low-cost raw ingredients (such as refined grains, industrial fats, and added sugars), additives to preserve and flavor, marketing, and economies of scale that favor highly processed products. Because whole foods drop off at a much slower rate, it costs more to transport, store, and process; therefore, many brands have leaned into UPFs to stay price-competitive. But now, as health policy and consumer awareness shift, that dependency becomes a risk.
And the risk is both regulatory and market based. The MAHA report, now reinforced by newer data, is shifting the public conversation toward policy interventions, including stronger labeling, restrictions on certain additives, and possibly tighter regulation of what qualifies for “healthy” labeling. For food companies, this means that reformulation is no longer optional; it has become a strategic necessity. Ingredients that help reduce sugar, limit unhealthy fats and additives, or replace processed ones with cleaner alternatives will be under more scrutiny. Brands that are ahead in cleaner labels or whole-food-focused formulations will likely have an edge.
There’s also a cost implication. Raw materials tied to UPFs—such as cheap sugar, refined grains, industrial fats, and additives—have had cost advantages, but these are shrinking. Health-driven reform (regulation, consumer demand) tends to increase input costs (for cleaner, less processed alternatives), possibly increase production complexity (shorter shelf life, different packing), and require investment in R&D. Smaller brands may struggle here if MOQs are high or if they’re locked into supplier networks optimized for UPFs.
Finally, it’s about positioning and trust. As consumers become more aware, because of reports like MAHA plus emerging data from CDC, there will be a rising demand for transparency: What’s in this product? How much processing? What additives are being used? What about non-GMO, organic, clean-label claims? These are no longer niche concerns — they’re moving toward mainstream expectations. Companies that are not ready for this shift risk losing market share or facing backlash; those that lead may gain brand loyalty, pricing power, and regulatory goodwill.
Erythritol AD/CD
The erythritol market continues to contract, and by now you know why — the AD/CVD investigation that Cargill filed back in December 2024. The case is scheduled to wrap up with a final decision in early December. We are now in the final phase, with importers and purchasers having submitted their questionnaires in late September, which will play a key role in shaping the outcome.
As of last quarter, a preliminary decision was issued on the countervailing duty (CVD) portion of the case. The Department of Commerce has imposed CVD duties of up to 3.49% on all imports of erythritol. While modest on the surface, this adds yet another layer of cost and complexity. Then, in July, the preliminary antidumping (AD) decision came down much harsher, with duties ranging from 371.53% to 450.64% depending on the manufacturer.
At Icon Foods, we remain firmly opposed to this petition. The U.S. erythritol market is valued at approximately $224 million, and Cargill already controls about 70% of it. Their filing only tightens an already strained market, especially for clean-label brands that need non-GMO and organic options — categories where Cargill does not currently participate. To add to the disconnect, while they’ve claimed erythritol’s fair market value is $7.21/kg, industry chatter suggests they’ve been offering “take-or-pay” contracts closer to $3.48/kg. That gap raises serious questions.
What Can You Do?
- Have open conversations with your supply chain partners. What steps are they taking to secure a stable supply and reduce risk?
- Stay close to pricing drivers. Don’t assume the listed price tells the full story.
- Review contracts carefully. Long-term agreements may look attractive, but they can carry clauses that end up costing you more than the margin.
How Icon Foods Has Your Back
We’re well stocked and taking proactive steps to protect customers who want to work collaboratively. We’re not just here to sell ingredients — we’re here to help you manage uncertainty and plan ahead.
We’ll continue to keep you informed as this moves forward. Let’s stay ahead of it together.
What’s Hot and What’s Not
Clean-label trends in the CPG sector are increasingly centered on the dual appeal of protein and fiber. Where protein once dominated the conversation, fiber is now emerging as a co-star, thanks to its links to satiety, digestive health, and overall wellness. Consumers are no longer satisfied with products that simply eliminate artificial colors or preservatives — they’re looking for ingredient transparency, traceability, and minimal processing, all while expecting functional benefits built into their snacks and meals. This convergence of “clean ingredients plus macros that matter” is driving innovation across categories.
When we look at the candy aisle today, it’s clear how much the landscape has shifted. We now have brands like SmartSweets,Zollipops, Kiss My Keto, Lily’s, and Shameless Snacks all competing to deliver the same nostalgic treats people know and love — but without the sugar. This indicates that consumers are seeking zero- to low-sugar options, yet they don’t want to compromise on taste, texture, or indulgence. The brands that lean into this shift and innovate quickly are the ones that will win in the long run.
Bars remain the hottest real estate for clean protein and fiber claims. Consumers can now choose from a wide variety of options tailored to different dietary needs: READY Clean Bars deliver around 15 grams of protein with added fiber, Transparent Labs emphasizes grass-fed whey and minimal ingredients, and Just Ingredients highlights real-food simplicity. Plant-based options, such as Orgain Organic Protein Bars and ALOHA Protein Bars, are thriving, each offering clean formulations with 14–15 grams of protein. IQBAR stands out with brain-health positioning, while David Protein Bars push the envelope with 28 grams of protein per bar, and Possible Snack Bars bridge the gap between indulgence and real-food snacking. Genius Gourmet is also reinventing nostalgic treats, like the classic nut bar paired with Skippy Peanut Butter, but without all the sugar, while expanding into clean protein beverages that speak directly to consumer interests in both convenience and functional nutrition.
Across all of these products, the common denominator is clarity and trust. Consumers want to know exactly what’s in their food, why it’s there, and how it supports their health. That means “clean label” is no longer just about what’s left out — it’s about building products with integrity, backed by protein, fiber, and transparent ingredient stories.
GLP-1 Drugs are Squeezing Food Spending — What that Means for CPGs
GLP-1 medications were a campfire conversation early in the year, and while they are no longer as loud a topic of conversation, they remain relevant and continue to shape the industry, driving innovations. GLP-1 medications are reshaping food and beverage consumption in ways the industry can no longer ignore. Within months of adoption, households spend 5–6% less on food overall, with cuts being felt most in indulgent categories, such as snacks, cookies, and fast food. At the same time, nutrient-dense and functional options are holding ground—or even gaining traction—as consumers prioritize satiety, protein, and health-forward cues.
High-profile users, including Serena Williams, are helping bring GLP-1s into mainstream conversation, giving the trend cultural visibility far beyond the medical community. That attention is already influencing product development. Brands like Nestlé have launched SKUs such as Vital Pursuit, a frozen line built around smaller portions, higher protein, and fiber content, designed specifically with GLP-1 users in mind. Beverage brands are also leaning into functional, gut-health-forward options, and better-for-you snack makers are experimenting with portion-controlled packs and fiber fortification.
The takeaway for CPGs is clear: reduced calorie intake is here to stay, and product portfolios will need to work harder to deliver functionality and satisfaction per serving. For formulators, this means a stronger emphasis on satiety ingredients, protein blends, and fibers that double as prebiotics—giving consumers “more for less” as eating patterns shift.
Innovation Isn’t Dead, It’s Just on a Tighter Budget
The word “recession” still reverberates in boardrooms, on trading desks, and in everyday conversations — and of late it’s gained more traction. While no one is ringing the alarm bells yet, we’re seeing telltale signs: consumer discretionary spending is softening, credit costs remain elevated, and capital is harder to access than it was just a year or two ago. Real personal consumption growth has already decelerated, significantly below the pace seen in late 2024.
So, rather than a sharp collapse, what feels more probable is drawn-out bleeding, a slow contraction already affecting some segments more severely than others. The food and beverage sectors have held up better than tech or housing, but even here, the fatigue is setting in: longer sales cycles, more cautious trade partners, and consumers trading down more often. At the same time, late summer spending still showed modest resilience, with households finding ways to prioritize essentials even as labor indicators softened.
On the monetary front, the Federal Reserve continues a delicate dance. Rate cuts that were once teased earlier in the year have been implemented, with one or two more expected to be announced before the end of the year. The consensus is that growth in 2025 will continue to slow, with consumption easing noticeably from the stronger pace of last year. For food and beverage and CPG businesses, this means continued pressure on borrowing, greater selectiveness around capital deployment, and heightened scrutiny of cost-to-innovation tradeoffs.
In this environment, CPGs are being forced into hard choices. Innovation hasn’t stalled — but it’s becoming more surgical. R&D must stretch ingredients, squeeze unit economics, and deliver wins across multiple dimensions: taste, label, function, and price. Moonshots are less welcome now; safe bets with predictable returns are getting more runway. Retailers, facing their own pressure, have reduced their risk tolerance. Shelf space is going only to fast-turning SKUs with established margins and a compelling narrative. If a product doesn’t solve a recognizable consumer pain point — whether around cost, health, or delight — it’s less likely to survive the category review.
This squeeze puts enormous strain on smaller brands and ingredient suppliers. But it’s also a filter for resilience. The players who lean into delivering measurable value — whether through clean-label formulations, functional claims, operational flexibility, or cost discipline — are the ones most likely to emerge intact, or even stronger. Innovation hasn’t disappeared, but it’s being taxed through a harsher economic lens.
The Job Market’s Not Crashing, But it’s Definitely Not Coasting
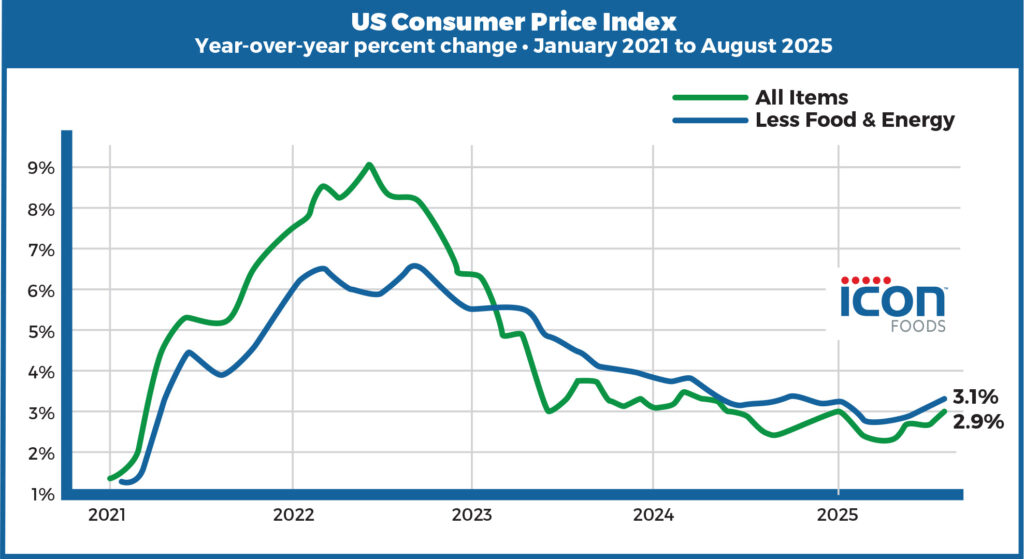
The August 2025 jobs report painted a picture of a labor market that is holding steady but showing signs of slowing momentum. Nonfarm payrolls grew by only 22,000 jobs; a relatively weak gain compared to earlier in the year. The unemployment rate remained unchanged at 4.3%, with little overall movement in the number of unemployed people. While this suggests stability, it also indicates an economy that is cooling, particularly as employers weigh hiring decisions against ongoing economic uncertainty and elevated borrowing costs.
Job growth in August was uneven across industries. Healthcare and social assistance continued to expand, reflecting ongoing demand for services and the sector’s resilience. In contrast, employment declined in areas such as the federal government, mining and extraction, and wholesale trade, sectors more exposed to budget tightening, global demand shifts, or commodity price volatility. This mix illustrates how the broader economy is slowing in certain areas, even as demand for specific services remains high.
Wages provided a modest bright spot, rising by 10 cents to an average of $36.53 per hour for private nonfarm workers. On a year-over-year basis, wages have increased by 3.7%, providing workers with some protection against inflation, although not the more substantial gains seen in past recoveries. Average weekly hours, labor force participation, and the employment–population ratio showed little to no change, suggesting that labor market dynamics are stable but lacking fresh momentum.
Taken together, these numbers point to a labor market in transition. Hiring has not collapsed, but the pace of job creation is significantly slower than it was in 2024. Combined with sticky inflation and delayed interest rate cuts from the Federal Reserve, businesses and workers alike are navigating an environment where growth opportunities exist but are harder to capture. The outlook ahead will likely depend on whether employers regain confidence heading into the fall or continue to hold back on expansion in the face of economic headwinds.
Economy Slows, Costs Stay High: What’s Next?
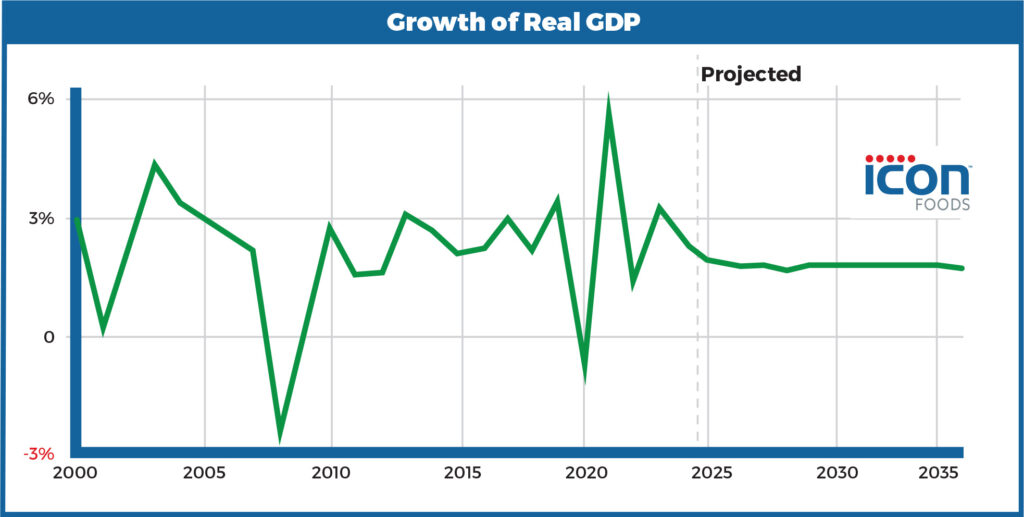
On September 17, 2025, the Fed cut its benchmark rate by 25 basis points to 4.00%–4.25%, the first reduction since December. On the surface, that sounds like a modest move, but the signal behind it is bigger. Inflation remains above target, unemployment is inching higher, and the Fed is attempting to strike a balance: keep prices in check without pushing the labor market or the economy into a downturn. The fact that they’re guiding toward more cuts later this year suggests they see growth as fragile enough that it needs a little support.
That lines up with the GDP data. Following a contraction of 0.5% in Q1, the economy rebounded with 3.3% growth in Q2. Most of that came from stronger consumer spending and a pullback in imports, which boosted net output. This is encouraging, but it also highlights how quickly momentum can shift from quarter to quarter. One weak stretch doesn’t mean recession, and one strong quarter doesn’t mean the recovery is locked in. What it does mean is that policy and markets will remain sensitive — a small shift in demand, rates, or supply chains can ripple quickly.
For our world, encompassing ingredients, supply chains, and food manufacturing, the GDP rebound, combined with lower interest rates, presents both opportunities and warnings. On one hand, cheaper borrowing costs make it easier to finance inventory, manage cash flow, or commit to larger purchase orders. A healthier economy also tends to support demand for finished goods, which is good news for brands across the board. On the other hand, stronger growth means more competition for freight, labor, and raw materials. If demand heats up faster than supply chains can respond, we’ll see higher transportation costs, port congestion, and upward pressure on inputs such as corn and sugar.
That’s why this moment is about strategy, not celebration. Rate cuts may provide some breathing room, but they don’t eliminate tariffs, ocean freight volatility, or the structural pressures we face every day. The companies that come out ahead will be those that plan proactively and partner with their supply chain teams, build in cost buffers, and lock in rates where possible. If we view this as an opportunity to anticipate volatility, the Fed’s move, combined with stronger GDP, can work in our favor. If we sit back and wait, the next swing in rates, costs, or consumer demand could catch us flat-footed.
Corn: Quiet Now, But Not Without Tensions
Currently, the corn futures market is trading in the low-to-mid $4.00 range, down slightly from earlier in the season as traders weigh the abundant supply and global risk factors. On the surface, the pricing environment appears calm, which gives food and beverage formulators some breathing room. But as with any commodity, calm doesn’t mean complacency — undercurrents are shifting.
US Crop Projections Hit New Records
The USDA now projects a U.S. corn crop of 16.814 billion bushels for the 2025/26 crop year, driven by increased harvested acreage. This tops previous forecasts and edges into record territory. Average yields are forecast at around 186.7 bushels per acre, slightly trimmed from earlier estimates, likely due to late-season stress and disease pressure. Ending stocks are projected to reach 2.11 billion bushels, the largest since the 2018/19 season, despite robust demand.
Globally, the picture is mixed. While U.S. coarse grain production is expected to rise, foreign production is facing downward adjustments in Europe and parts of Asia due to heat, drought, and area reductions. These shifts heighten sensitivity to weather, trade, and policy changes outside the U.S.
Demand Holds, But Margin Sensititivites Grow
Demand for corn remains strong across the food, feed, and biofuels sectors. However, as margins tighten globally, the cost structure for corn-derived ingredients — especially those produced outside the U.S. — is under more scrutiny. Ingredients like glucose, dextrose, and derivatives (used in sweeteners such as allulose or erythritol precursors) remain exposed to input cost swings.
Key Indicators to Monitor
Even with favorable U.S. projections, several pressure points bears watching:
- Brazil’s next crop is slated to be a record-setting crop with estimates anticipating production around 131.0 MMT or higher.
- U.S. export volume and logistics
- Policy shifts, trade agreements, or tariff changes affecting corn and derived ingredient flows
In short, the corn market is quieter than it was earlier in 2025, but that doesn’t mean volatility is off the table. With record U.S. output providing some insulation, the real risks now lie in global production disruptions, trade dynamics, and shifts in demand. Keeping flexibility in contracts, closely monitoring external geographies, and hedging where feasible are all prudent steps.
Sources:
- https://www.cmegroup.com/markets/agriculture/grains/corn.html
- https://www.usda.gov/oce/commodity/wasdeUSDA Crop Production & WASDE Reports (September 2025)
- https://www.reuters.com/sustainability/climate-energy/usda-projects-record-us-corn-crop-most-harvested-acres-since-1933-2025-09-12?utm_source=chatgpt.com
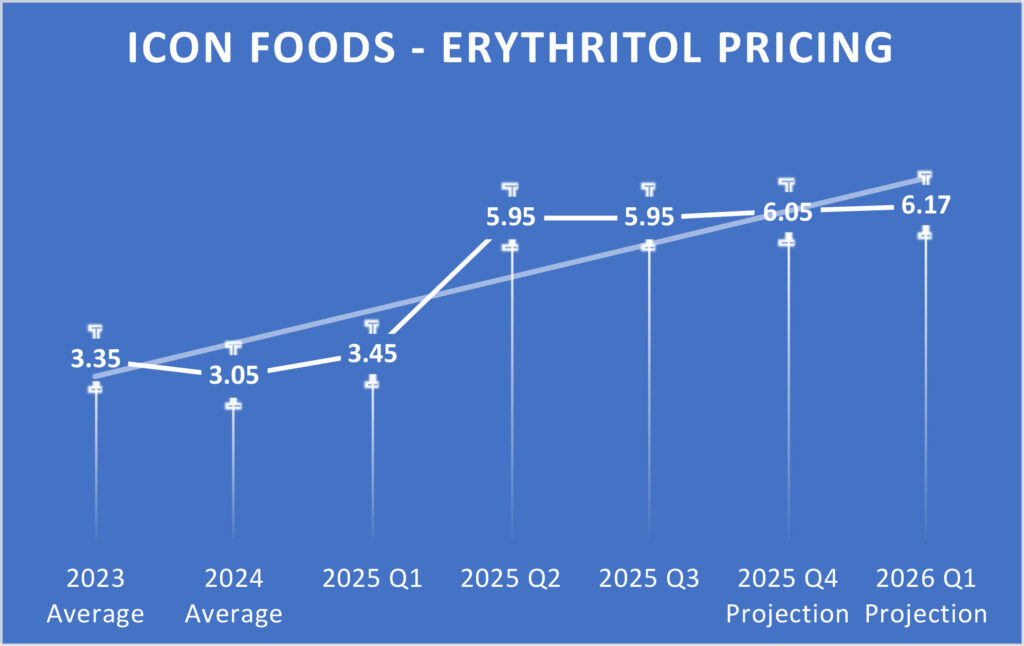
Erythritol: Pricing and Market Update
Erythritol remains one of the most valuable tools for reducing sugar without compromising functionality, but the U.S. market is still navigating a significant amount of uncertainty. With the AD/CVD petitions still pending, importers are adding a risk premium of approximately $0.50–$1.00 per kilogram to landed costs. For most buyers, that puts pricing in the $5.95-$7.00/kg range, depending on format (conventional, organic, or non-GMO), and logistics. We’ve even seen spot buys creep higher when supply has gotten especially tight.
Even with this volatility, demand hasn’t slowed. Formulators are leaning on erythritol as the backbone of their reduced-sugar systems, often pairing it with stevia, monk fruit, or allulose to balance sweetness curves and manage costs. Across all three categories—conventional, organic, and non-GMO—interest remains strong, especially as consumers pay closer attention to sourcing claims alongside nutritional benefits.
On the global stage, growth is steady. Market projections call for a CAGR of 5.5%–7.6% into the early 2030s, with overall market value expected to reach USD 544 million by 2035. Expanded applications in snacks, beverages, and nutraceuticals will continue to fuel that growth.
For R&D teams, the key is building flexibility. Price swings can often be avoided by working collaboratively with your supply chain partners to secure locked-in pricing and stable inventory commitments. Those proactive conversations go a long way in protecting both innovative timelines and cost targets.
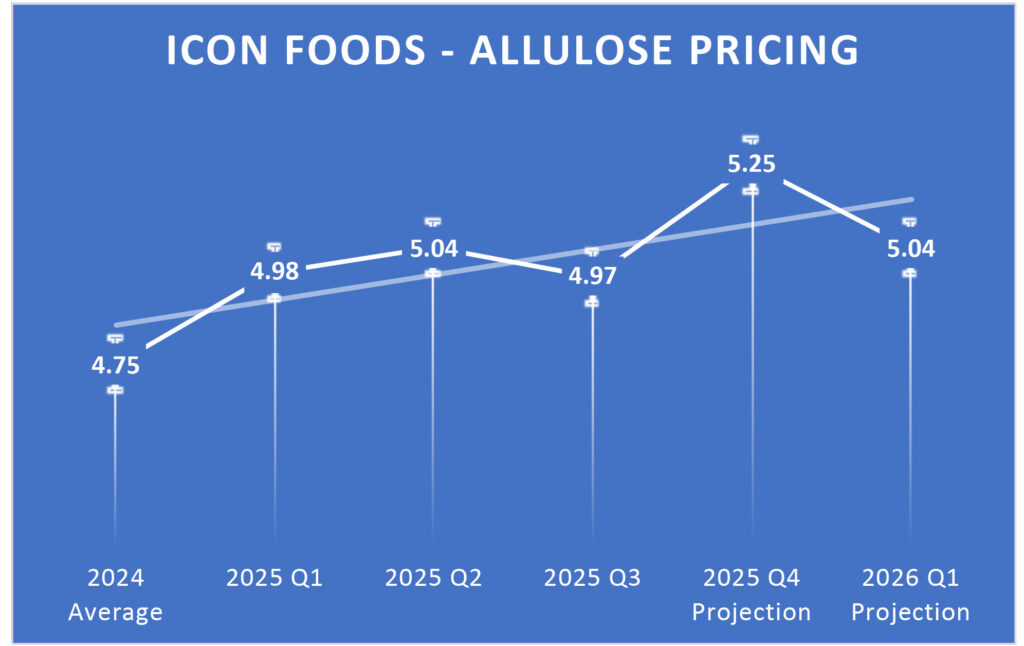
Allulose: Pricing and Market Update
Allulose continues to gain traction as one of the most promising rare sugars for sugar reduction, delivering approximately 70% of the sweetness of sucrose with nearly zero calories and strong functionality in baked goods, sauces, frozen desserts, and dairy products. It offers a clean flavor without the bitterness or cooling effect often tied to other alternatives, and its ability to brown, resist crystallization, and mimic sugar’s texture makes it especially valuable in formulation.
Powdered allulose remains the go-to format in the U.S., in part because it holds GRAS status and is excluded from both “total sugar” and “added sugar” labeling requirements—an advantage for brands looking to make front-of-pack claims. Interest is also increasing in the Asia-Pacific and Latin America regions, where consumer demand for low-glycemic, reduced-calorie options is growing rapidly.
On the pricing side, import costs have been fluid as suppliers manage global logistics and shifting trade policies. Allulose is not currently subject to broad tariffs, though baseline duties may apply depending on the country of origin. For most buyers, delivered costs range from $4.95 to $5.45/kg across conventional, organic, and non-GMO formats, with purity and logistics influencing the final price.
Despite these dynamics, market momentum is strong. The global allulose category was valued at just under USD 300 million in 2024 and is forecast to approach USD 500 million by 2031. More aggressive projections suggest it could surpass USD 1 billion by the mid-2030s, fueled by innovation in functional foods, beverages, and sports nutrition, as well as growing interest in clean-label sugar alternatives.
For R&D teams, the takeaway is clear: allulose commands a premium, but the return in taste, flexibility, and consumer acceptance is significant. Pricing volatility can often be mitigated by working proactively with supply chain partners to lock in costs and secure stable inventory, ensuring projects move forward without disruption.
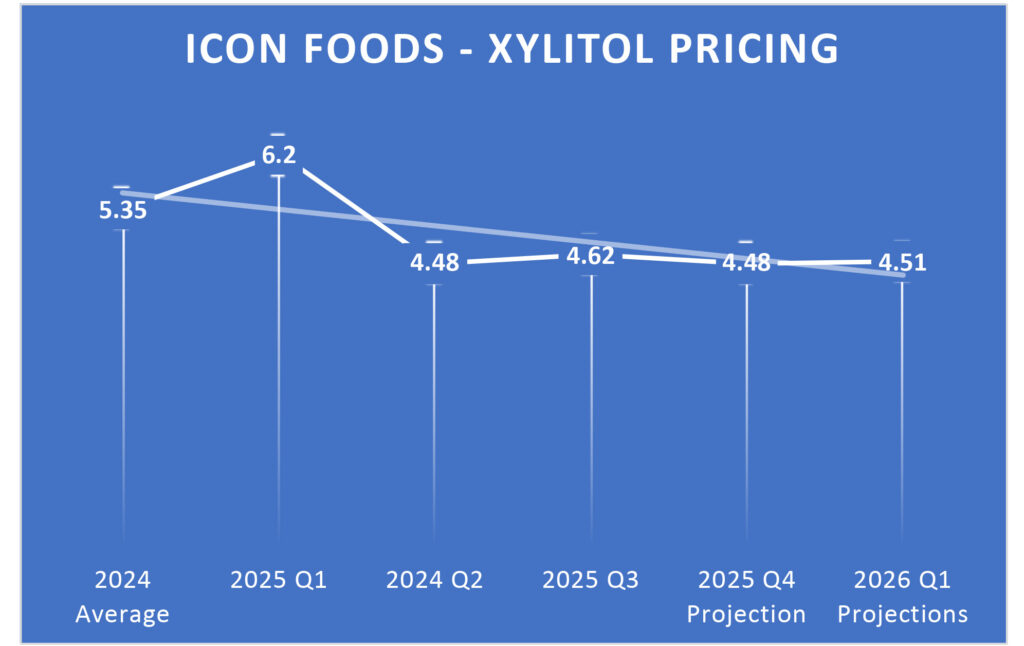
Xylitol: Pricing and Market Update
Xylitol remains a unique presence in the sweetener landscape. Unlike high-intensity options, it matches sugar’s sweetness one-to-one, making it a straightforward replacement in many formulations. Its dental health benefits also give it an edge in categories like gum, mints, and oral care products, while its cooling effect and stability in frozen systems make it useful in certain confections and dairy alternatives.
Pricing has been anything but steady. Current import costs range from $3.00 to $6.00/kg, influenced by purity, order size, and the location from which the material is sourced. Lower-grade or high-volume orders typically fall closer to the bottom of that band, while premium lots or smaller buys tend to trend higher. With the bulk of supply still originating in China, water-intensive production processes and environmental taxes continue to keep baseline costs elevated.
Globally, xylitol is experiencing gradual growth. The market was valued at USD 1.0–1.4 billion in 2024 and is expected to reach as much as USD 2.3 billion by the early 2030s, expanding at a CAGR of 4–6%. North America remains the strongest market, but consumer demand for low-glycemic and “tooth-friendly” sweeteners is driving faster adoption in the European and Asia-Pacific regions.
From a functional standpoint, xylitol offers versatility but also requires careful handling. It is hygroscopic, which can lead to clumping or texture issues if storage conditions are not carefully managed. Crystallization is another challenge in certain systems, and like other polyols, it can cause digestive upset at higher doses. Still, its sugar-like sweetness and clean taste keep it in steady rotation for R&D teams looking for bulk sweetener alternatives.
For developers, the strategy is less about whether to use xylitol and more about how to use it well. Its strengths shine when paired with thoughtful formulation design, reliable sourcing, and clear cost planning. Collaborating with supply chain partners to secure consistent pricing and dependable supply is the most effective way to manage risk while leveraging the benefits of xylitol.
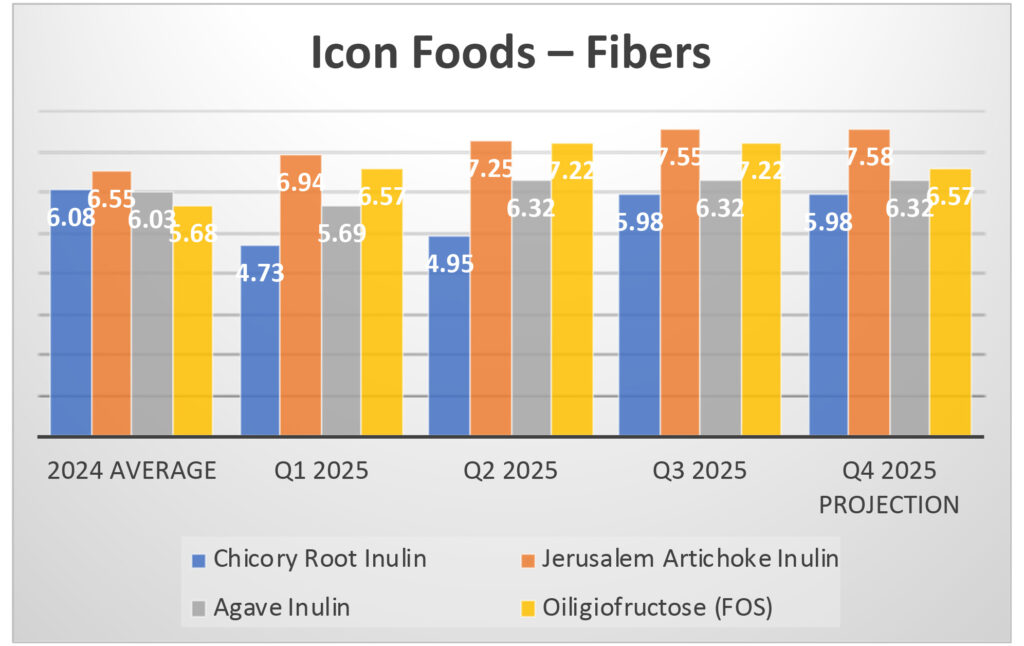
Inulin: Pricing and Market Update
Inulin remains a cornerstone of the clean-label fiber space, prized for its prebiotic benefits, mild sweetness, and ability to mimic the texture and sweetness of fat or sugar in formulations. Market pricing has been relatively steady, although we continue to see slight upward pressure as demand grows faster than new capacity can be brought online. The global value for the category stood at USD 1.8–2.0 billion in 2024 and is on track to approach USD 3.5 billion by the early 2030s, supported by strong adoption across functional food, supplements, infant nutrition, and even pharmaceuticals.
Powdered chicory root inulin remains the leading option, although agave and Jerusalem artichoke formats are gaining more attention in organic and specialty channels. Both conventional and organic versions stay in high demand, particularly in North America and Europe, while Asia-Pacific continues to accelerate adoption on the back of rising gut health awareness.
From a technical standpoint, inulin is a powerful but finicky substance. Its hygroscopic nature requires careful storage to avoid clumping and shelf-life issues, and differences between short-chain and long-chain structures can create wide variation in solubility, sweetness, and texture. Used properly, however, it provides valuable prebiotic benefits, satiety advantages, and a cleaner nutritional profile.
FOS: Pricing and Market Update
Fructooligosaccharides (FOS) are gaining traction as formulators seek flexible prebiotic solutions. While inulin often dominates the conversation, FOS offers a subtle sweetness, low-calorie profile, and clean-label positioning that make it a strong fit for brands chasing gut health trends. Market pricing remains favorable relative to inulin, giving FOS an edge where cost efficiency is a priority.
One of its strategic strengths is label agility. Because FOS can be used interchangeably with inulin on pack claims, brands gain flexibility to adjust formulations based on availability, cost, or functionality—without needing packaging overhauls. That ability to pivot has become increasingly valuable as supply chains stay tight.
The applications are widening quickly. What started in prebiotic sodas is now appearing in protein bars, gummies, hydration mixes, and even infant formulas as an early-stage alternative to HMOs. In the Asia-Pacific region, FOS is gaining ground rapidly thanks to aging populations, diabetes management, and a long-standing cultural familiarity with dietary fibers. Global value is forecast to reach USD 4.45 billion by 2029 at a CAGR of 8.5%, but the more important signal is its shift into a formulator-first ingredient—an everyday tool, not just a marketing story.
We’ve expanded beyond single-source fibers by developing tailored blends of fibers that include inulin and FOS, designed to perform across a range of applications—from beverages and bakery products to bars and dairy analogues. By balancing chain length and functionality, these systems provide formulators with greater control over sweetness, mouthfeel, stability, and digestive tolerance, enabling them to meet performance targets while maintaining clean-label claims and achieving cost efficiency.
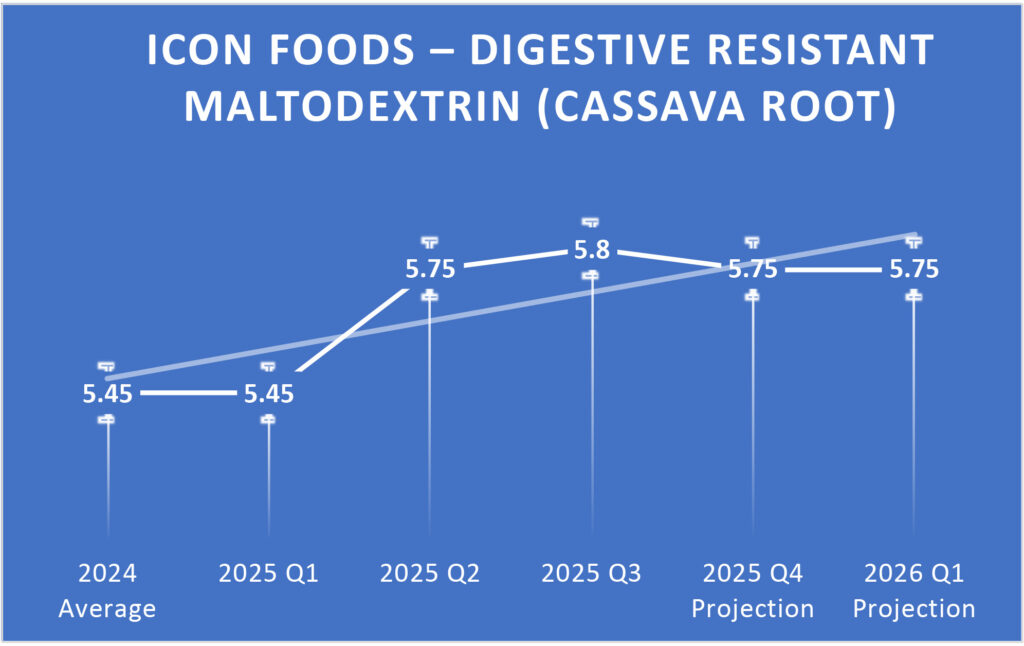
Soluble Tapioca Fiber: Pricing and Market Update
Soluble tapioca fiber is gaining traction as brands lean into ingredients that support digestive wellness, satiety, and clean-label positioning. Its neutral flavor, smooth functionality, and prebiotic potential make it a standout choice for product developers seeking to deliver both nutritional value and consumer-friendly sensory qualities.
The category itself is expanding quickly. Valued at USD 13.25 billion in 2023, the soluble fiber market is projected to nearly double to USD 29.75 billion by 2032, growing at a CAGR of 9.2%. Much of this growth is being driven by beverages and functional foods—from prebiotic sodas and protein shakes to better-for-you snacks—where soluble tapioca fiber enhances mouthfeel, improves texture, and strengthens gut-health positioning.
At Icon Foods, we’re strengthening our commitment to this space. In Q2, we officially joined the Global Prebiotic Association and are in the process of certifying our fibers through them. This step reinforces our commitment to science-backed claims and provides formulators with confidence in the prebiotic value of our offerings.
From a supply standpoint, we’ve taken a proactive approach: our sourcing does not primarily depend on Chinese production, insulating our supply chain from tariff risk, geopolitical volatility, and freight disruptions. This strategy allows us to consistently deliver soluble tapioca fiber in both powder and liquid formats, available in conventional and organic options.
For R&D teams, soluble tapioca fiber is more than a nutritional add-in; it’s a multifunctional tool that can differentiate products in crowded categories. Collaborating with supply chain partners to secure locked-in pricing and stable contracts is the most effective way to manage costs while ensuring innovative timelines remain intact.
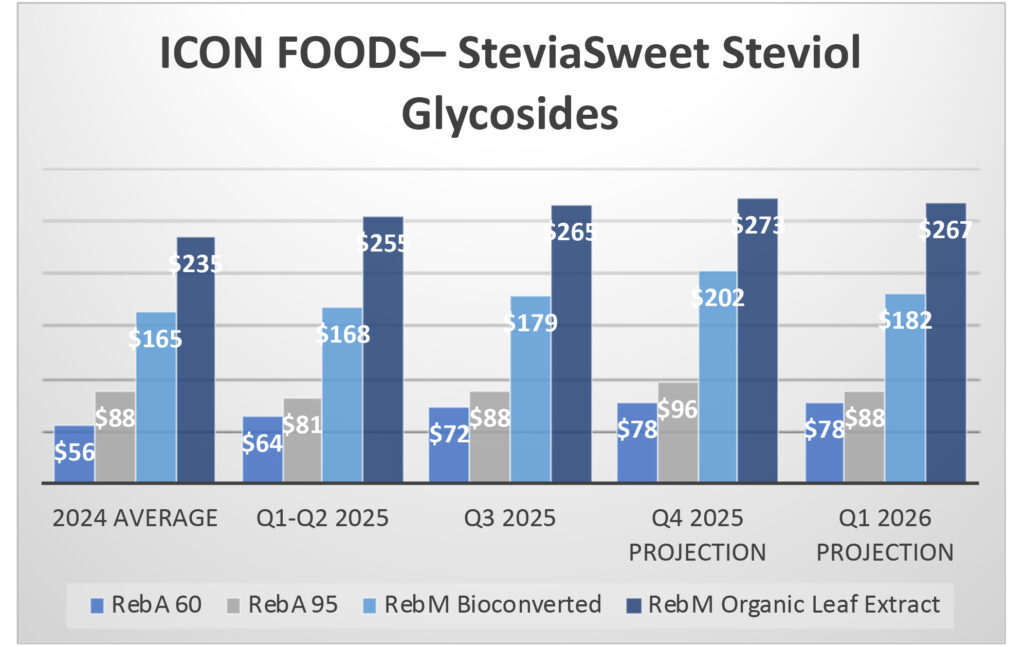
Stevia: Pricing and Market Update
Stevia remains one of the fastest-growing natural sweeteners, thanks to its clean-label appeal and strong alignment with consumer demand for reduced sugar. The global market is projected to grow at a CAGR of 10–12%, with value estimates reaching USD 1.4–1.5 billion by 2030–2033 and potentially USD 2 billion by 2032. Asia-Pacific remains the largest move into the new year. This makes now an important time for formulators to engage in forward-looking conversations with their supply chain partners to secure predictable costs and consistent inventory.
From an application perspective, innovation is occurring most rapidly around organic grades and glycoside blends. We’re seeing a meaningful uptick in interest for Organic RM95 specifically, as well as stevia–monk fruit combinations, both of which deliver cleaner sweetness profiles and minimize the bitterness or licorice-like notes associated with earlier generations of stevia. Pairing stevia with monk fruit has proven effective at smoothing sweetness curves, allowing formulators to achieve a more sugar-like taste with fewer off-notes.
At Icon Foods, we’re leaning into these trends by expanding our organic portfolio and developing flexible glycoside systems that provide R&D teams with the flexibility to customize sweetness quality across beverages, dairy, confectionery, and beyond. As demand continues to climb, securing a reliable supply of organic and blended stevia solutions is the best way to keep projects on track and costs under control.
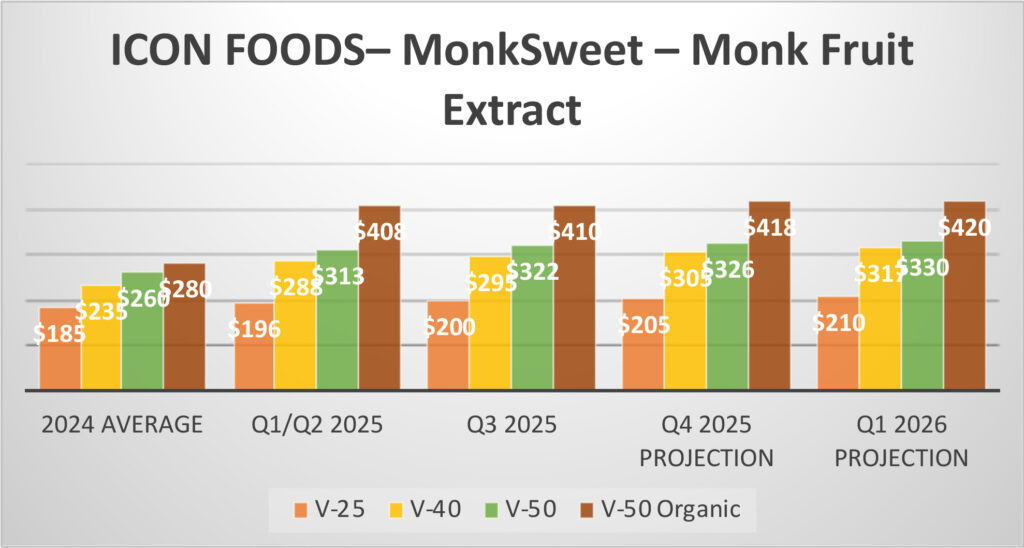
Monk Fruit Extract: Pricing and Market Update
Monk fruit extract remains one of the most sought-after high-intensity sweeteners in clean-label formulation. Known for its zero-calorie profile and plant-based origin, monk fruit delivers a sweetness level up to 200–300 times that of sucrose, making it a powerful tool for reducing added sugars without compromising taste. When paired with stevia, both ingredients, each known for distinct off-notes, can effectively offset one another, creating a smoother sweetness curve and a more sugar-like taste profile.
Powdered monk fruit extract remains the preferred format in the U.S., supported by its GRAS status and broad consumer acceptance as a natural, label-friendly ingredient. Demand is also expanding globally, particularly in the Asia-Pacific and Latin America regions, where interest in low-calorie, plant-based alternatives is accelerating.
On the pricing side, monk fruit extract carries a significant premium due to limited growing regions and complex extraction processes. Current delivered pricing varies considerably based on concentration grade:
- V25 (≈25% Mogroside V): $179–$262/kg — often used in blends with stevia or bulk sweeteners.
- V40 (≈40% Mogroside V): $257–$396/kg — the mid-range grade, widely used for its balance of sweetness and functionality.
- V50 (≈50% Mogroside V): $278–$477/kg — the premium option, delivering a cleaner taste profile and higher sweetness intensity.
Organic and non-GMO certifications typically add premiums across all three grades, while seasonal harvest fluctuations, freight exposure, and order volumes also play into final landed costs.
Market momentum remains strong. The global monk fruit category was valued at around USD 250 million in 2024 and is projected to surpass USD 500 million by the early 2030s, reflecting a CAGR of roughly 8%–9%. Expansion is being driven by the launch of functional beverages, sports nutrition formulations, and clean-label snacking trends, alongside growing demand from consumers seeking natural, plant-based sweetener options.
For R&D teams, the key is to treat monk fruit as part of a system. While it carries a premium cost, its ability to improve taste, reduce reliance on other sweeteners, and support consumer-friendly labeling makes it highly valuable. Price swings can be managed by partnering with supply chain teams to secure forward contracts and locked-in pricing, ensuring consistent access to the right grade for your projects.
Cocoa’s Future State: What Lies Ahead
Cocoa’s future remains defined by both volatility and long-term structural change. After historic price spikes in 2023–2025, analysts expect some moderation in the years ahead, though costs are unlikely to return to pre-crisis levels. Futures are currently trading near USD 6,900–7,000/tonne, and while improved weather and supply recovery could ease pressure by mid-2027, persistent challenges in production will keep prices elevated above historical norms.
One of the biggest shifts on the horizon is supply diversification. With over 60% of cocoa still sourced from Ghana and Côte d’Ivoire—regions facing aging trees, disease, and climate stress—new origins are gaining importance. Ecuador, for example, is on track to become the world’s second-largest cocoa producer, and other producing regions are investing heavily in higher-yielding crops. This gradual rebalancing may reduce global exposure to West African supply shocks.
Demand trends add another layer of complexity. Recent reports indicate that cocoa grinding volumes in Asia declined sharply (down 16% year-over-year in Q2 2025), suggesting that high raw material costs are already prompting cutbacks in chocolate production. If prices remain high, demand elasticity may continue to prompt manufacturers to reformulate their products, reduce portions, or incorporate alternatives.
Sustainability is also shaping the future of the cocoa industry. Carbon accounting is beginning to influence pricing, with premiums emerging for low-carbon or fully traceable bean lots. As carbon border adjustments and ESG frameworks expand, farming practices and origin certifications will increasingly affect both access and cost.
Looking ahead, weather volatility, disease pressure, speculative trading, and shifting trade policy remain wild cards that could intensify instability at any point. For brands and formulators, the path forward lies in diversification, forward contracting, and exploring innovative alternatives. One example is our new 4M allulose-based chip, which Icon Foods will be fully commercializing in mid-October. These inclusions provide a cost-stable, reduced-sugar option that mimics the indulgence of chocolate while reducing reliance on volatile cocoa supply.
By combining forward-looking supply strategies with innovative ingredient systems, such as allulose chips, manufacturers can remain resilient and continue delivering products that balance indulgence, functionality, and affordability, even in an unpredictable cocoa market. Cocoa’s future remains defined by both volatility and long-term structural change. After historic price spikes in 2023–2025, analysts expect some moderation in the years ahead, though costs are unlikely to return to pre-crisis levels. Futures are currently trading near USD 6,900–7,000/tonne, and while improved weather and supply recovery could ease pressure by mid-2027, persistent challenges in production will keep prices elevated above historical norms.
One of the biggest shifts on the horizon is supply diversification. With over 60% of cocoa still sourced from the Ghana and Côte d’Ivoire regions, which are facing aging trees, disease, and climate stress, new origins are gaining importance. Ecuador, for example, is on track to become the world’s second-largest cocoa producer, and other producing regions are investing heavily in higher-yielding crops. This gradual rebalancing may reduce global exposure to West African supply shocks.
Demand trends add another layer of complexity. Recent reports indicate that cocoa grinding volumes in Asia declined sharply (down 16% year-over-year in Q2 2025), suggesting that high raw material costs are already prompting cutbacks in chocolate production. If prices remain high, demand elasticity may continue to prompt manufacturers to reformulate, reduce portions, or incorporate alternatives.
Sustainability is also shaping the future of the cocoa industry. Carbon accounting is beginning to influence pricing, with premiums emerging for low-carbon or fully traceable bean lots. As carbon border adjustments and ESG frameworks expand, farming practices and origin certifications will increasingly affect both access and cost.
Looking ahead, weather volatility, disease pressure, speculative trading, and shifting trade policy remain wild cards that could intensify instability at any point. For brands and formulators, the path forward lies in diversification, forward contracting, and exploring innovative alternatives. One example is our new 4M allulose-based chip, which Icon Foods will be fully commercializing in mid-October. These inclusions provide a cost-stable, reduced-sugar option that mimics the indulgence of chocolate while reducing reliance on volatile cocoa supply.
By combining forward-looking supply strategies with innovative ingredient systems like allulose chips, manufacturers can stay resilient and continue delivering products that balance indulgence, functionality, and affordability—even in an unpredictable cocoa market.
Final Takeaway — Q4 2025: Play Offense, Not Defense
This isn’t the quarter to play it safe. Tariffs, freight, regulatory crackdowns, shifting consumer behavior, they’re not temporary hurdles; they’re the new baseline. If you’re still waiting for “normal” to return, you’re already behind. The winners in this industry are the ones rewriting the playbook: locking in supply before the squeeze, reformulating before regulation forces their hand and leaning into sugar reduction systems that deliver value beyond claims.
Consumers aren’t lowering the bar. They want clean label, real functionality, satiety, and indulgence — and they want it now. If your product can’t deliver on all fronts, someone else’s will.
At Icon Foods, we’re focused on helping our customers navigate this shifting landscape; whether that means exploring blend options, securing forward contracts, or ensuring consistent access to conventional, organic, and non-GMO formats. Regardless of SKU, clean-label sugar reduction is a smart choice—but it pays to plan ahead.
Icon Foods is committed to being a trusted partner in an ever-changing industry. Our goal is to make life easier for you and your team by delivering concierge-level service and creating value where it matters most, helping you move projects forward with confidence and clarity.
Until then, thank you for trusting us as your partner. Let’s continue to solve challenging problems together. Thank you for your continued support.
Kash
Disclaimer
The opinions expressed in this newsletter are solely those of Icon Foods and do not necessarily represent the views of any affiliated parties. While we make every effort to ensure that the information provided is accurate and current, we cannot guarantee its completeness or reliability. Icon Foods is not responsible for any inaccuracies, errors, or omissions contained herein, nor for any consequences that may result from the use of this information. Readers are encouraged to conduct their own research and verification before making decisions based on the content provided.