Preparing for Q2 2024: Market Intelligence Report
Good afternoon fellow food scientists, manufacturers, formulators, and enthusiasts of Clean Label Sugar Reduction. You know, in the past, we’ve seen our fair share of challenges and disruptions in the supply chain. 2023 was a year of recovery, giving the air of a return to normal. Sadly, normal for supply chains means guiding operations through a storm of potential disruptions. Looking ahead to the second quarter of 2024, some minor disruptions are already on the horizon—including the conflict in the Middle East and the prospect of a renewed wave of trade protectionism. Other problems will emerge by surprise, reinforcing the importance of investing in resilience. Let’s peel away the layers and see what’s inside and what’s in store for the next few months. Let’s do this!
OVERALL ECONOMY & FOOD PRICES
In 2023, food prices increased by 5.8 percent. Food-at-home prices increased by 5.0 percent, while food-away-from-home prices increased by 7.1 percent. In fact, prices increased across the board for all food categories tracked by the U.S. Department of Agriculture (USDA), Economic Research Service (ERS). Fats and oils had the largest average price increase (9.0 percent) between 2022 and 2023, followed by sugar and sweets (8.7 percent), cereals and bakery products (8.4 percent), and processed fruits and vegetables (8.0 percent) (10).
Food prices are expected to continue to decelerate in 2024. In 2024, all food prices are predicted to increase 1.3 percent, with a prediction interval of -1.4 to 4.2 percent. Food-at-home prices are predicted to decrease 0.4 percent, with a prediction interval of -4.5 to 4.0 percent, and food-away-from-home prices are predicted to increase 4.7 percent, with a prediction interval of 3.1 to 6.2 percent (10).
Surprisingly, one category that has come roaring back is snack foods (7). While the bigger CPGs may not be feeling the love, smaller more innovative brands that are in the clean label, lower sugar, and healthier-for-you category are seeing solid velocity in retail and direct-to-consumer spaces. Chips, pretzels, and other snacks are outpacing traditional snack foods like cheese and meat. This will be a massive trend over the year with more and more folks jumping on the GLP-1 (Ozemptic) train. If your brand had trouble in 2022 and 2023, 2024 could be your year.
WHAT IS GOING ON WITH SUGAR?
While sugar is out of the Icon Foods’ wheelhouse for the most part, we do like to keep an eye on the market. In part because we are against sugar, but also because a lot of resistance towards natural sweeteners has always been rooted in pricing. Often, we hear that “sugar is so cheap.” Well, the global cost of sugar has risen to its highest level since 2011, following concerns of underproduction rates from countries such as Thailand, which is facing a severe drought (4).
Similarly, in September 2023, India saw sugar prices jump by more than 3% in two weeks, reaching their highest level in six years. This followed a period of low rainfall in the country’s key growing regions and raised serious production concerns for the upcoming growing season. It also raised concerns internationally, as many fear that traders and industry officials could discourage the country from allowing sugar exports, putting further pressures on demand, and again driving upward pressure on pricing. Now might be a good time to consider sugar reduction for many reasons.
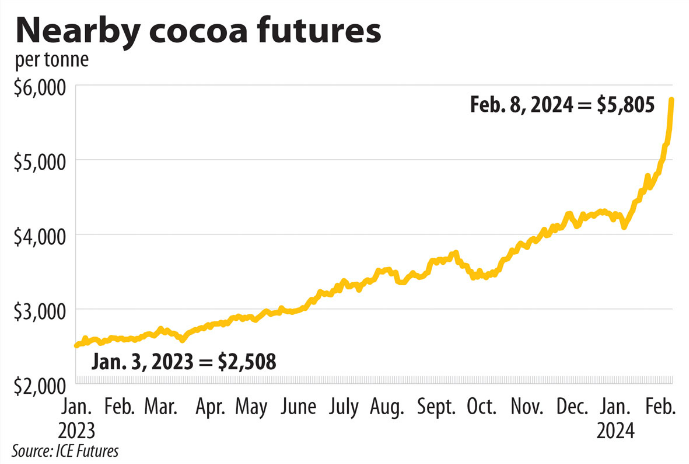
WHAT IS GOING ON WITH CHOCOLATE?
I would be remiss if I didn’t drop something in here about the state of chocolate. Cocoa prices have surpassed a 46-year-old record, with cocoa futures closing Thursday at $5,635 per metric ton, surpassing the previous record of $5,368 set in July 1977. This 7.1% price increase arrived just ahead of Valentine’s Day (2).
Projections indicate a greater global deficit for 2023-24 than previously anticipated. Cocoa bean arrivals at ports in the Ivory Coast and Ghana, the two leading cocoa bean producers globally, have been approximately 35% lower compared to the same period last year. “Cocoa’s troubles stem from extreme weather in West Africa, where farmers grow the majority of the world’s cacao beans” (8).
According to Billy Roberts, a senior analyst at CoBank, West Africa experienced extensive rainfall followed by a prolonged dry spell and strong winds, creating harsh growing conditions for cocoa (8). Pest and diseases have only exacerbated existing issues.
Consequently, cocoa harvests have fallen short for the third consecutive year.
Buyers may not have to worry about high prices in the short term. Chocolates for the Easter season are likely already manufactured and waiting in warehouses or on store shelves. The real test of pricing will come later this year with products that are not yet produced, according to Matt Spooner, a thought leader with management company Kinaxis—which works with cocoa producers on securing their supply chains (1).
Spooner anticipates a price hike in chocolate towards the end of the year, particularly around Thanksgiving and Christmas, as manufacturers begin passing on additional costs (1).
What do these persisting market conditions mean for food manufactures relying on chocolate inclusions?
It means the time to stock up on chocolate is now.
Icon Foods chocolate chips, coatings, and candies are zero sugar added with no compromise on flavor or mouthfeel. Non-GMO and made with diabetic-friendly sweeteners, they add flavor and texture to applications while driving down water activity.
CORN
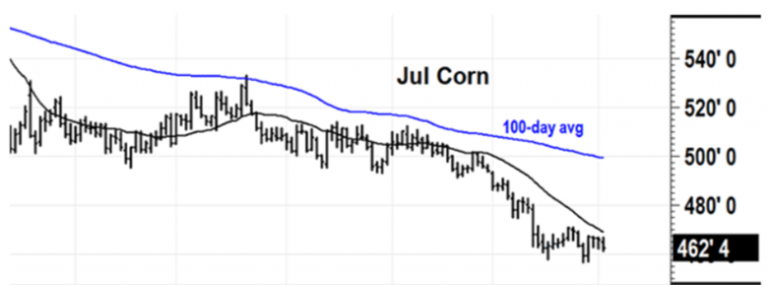
Corn prices are trading near the lowest levels in over three years following months of declining prices amid a bearish fundamental backdrop. An overabundance of supply, lagging consumption, and weak export demand have plagued the commodity recently, but some traders think the lows might be in (11). Let’s have a look at the graphs.
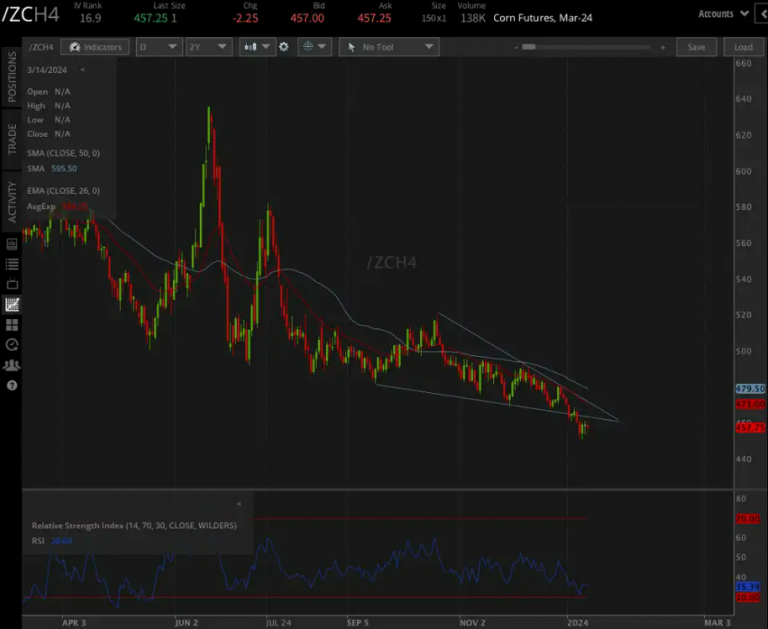
If you look at the trendline, we are about three months from an upturn. This is the global perspective. However, pricing aligns globally and domestically. It’s likely the only user that sources domestic corn to transform into polyols is Cargill. Those polyols are divided equally between Ingredion and ADM for use in other sweeteners. The rest is sourced outside the US market.
In case you were curious, the graph below illustrates which countries are the biggest exporters of the golden kernels.
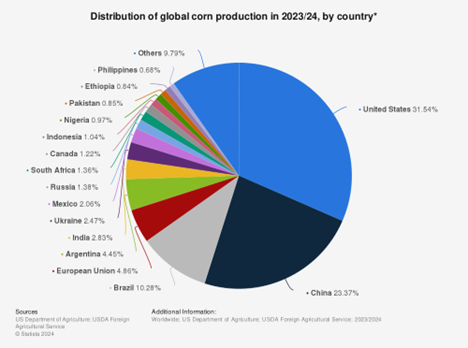
Obviously, the question is, “how does this affect me?” Corn is the richest source of glucose; glucose is the most efficient substrate for polyols like erythritol, rare sweeteners like allulose, and everything in between—acidulant, gluconates, and more. If there is an abundance of corn and the price is way down, it makes sense that the corn derivatives will follow suit. More on this as we cover sweeteners.
LOGISTICS
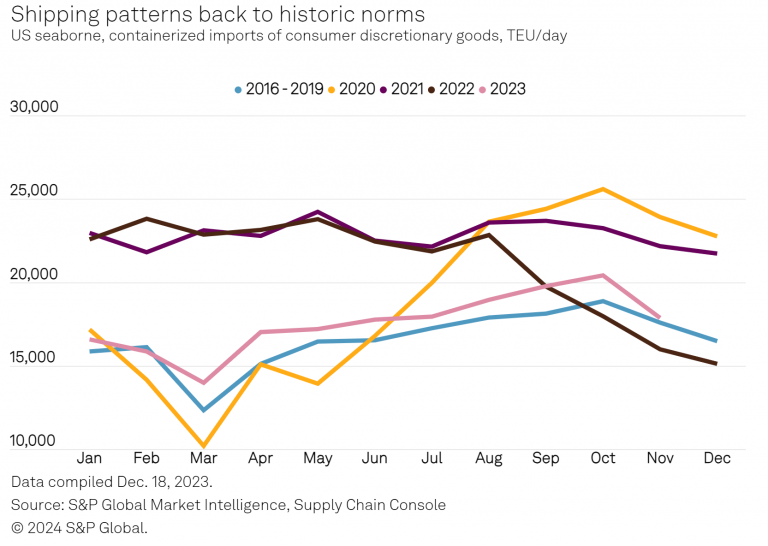
In the past year, everyone has been enjoying low container prices. It’s been great. Even the conflict in the Red Sea turned out to have no long-term supply chain repercussions. While there was a 2x uptick in container pricing, this almost immediately normalized. The only real downside was a 9-day delay in cargo going around the horn of Africa.
As far as FTL, LTL, and intermodal goes, the two key numbers produced by the U.S. Bank Freight Payments Index are for shipments and spending.
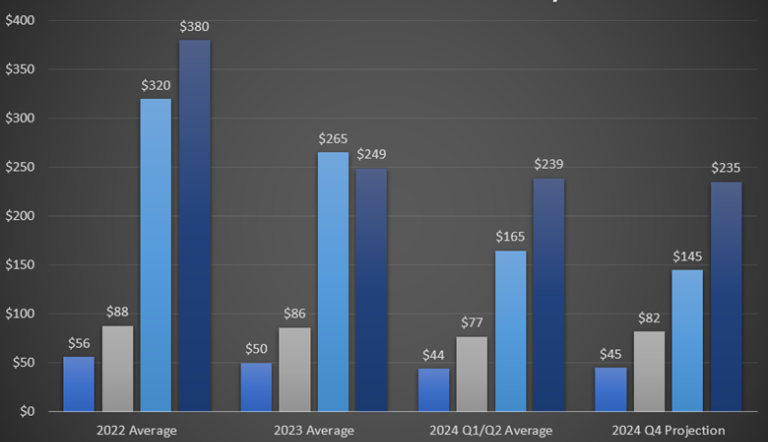
Both indicators declined relative to the third quarter. The Shipments Index value was 95.0, down 10.9% from the prior quarter’s figure of 106.6. The Spend Index was 233.9. That was down just 1.4% from the previous quarter, but down 13.5% from the corresponding quarter of 2022. The Spend Index does include diesel spending, which U.S. Bank said was 15.5% less than a year earlier, based on its data (6).
In what might be considered the most accurate summation of the current market, the U.S. Bank commentary said: “As shipments volumes contract, it results in too many trucks chasing too little freight” (6).
But the bank also noted that given that the Shipments Index was down 10.9% and the Spend Index dropped just 1.4% relative to the third quarter, that variance is “suggesting that the market may be moving closer to balance between supply and demand.” What does all this mean? Supply and demand. We are seeing demand creep closer to supply. The prediction: we will see an uptick in freight in the next two or three months, probably to the tune of 3-5% (6).
Whilst cries of Rome burning may be echoed in the logistics offices across CPG brands, the data says different. Enter the U.S.D Freight Logistics Optimization Works (FLOW). FLOW is a public-private partnership among industry and government to build a forward-looking, integrated view of supply chain conditions in the United States. FLOW data helps forecast how current capacity and throughput will fare against future demand, helping participating companies anticipate changes in supply chain throughput and take proactive step to mitigate previously unanticipated delays. Yes! Our tax dollars hard at work.
Like I noted earlier, the Red Sea turned out to not be a big deal, but one issue that is causing me a little heart burn is the Panama Canal—specifically the water level of Gatun Lake. Gatun Lake is a freshwater manmade lake to the south of Colón, Panama, that forms a major part of the Panama Canal, carrying ships across the Isthmus of Panama and through the canal. Climate change has significantly impacted the water levels of Lake Gatun. “According to data from the Panama Canal Authority (ACP), the average water level for February currently stands at 80.3 feet. This figure sharply contrasts with the five-year moving average of 83.9 feet around this time of the year. While the difference may appear modest, it’s essential to note that over the past five years, the lowest average lake levels have typically been recorded in May, averaging at 82.5 feet. This trend paints a concerning picture for the future of transits through the Panama Canal, as any reduction in Gatun Lake’s levels directly impacts the number of allowed transits” through the canal—causing a log jam and a disruption in supply chains (3). The good news is that weather forecasts indicate an improvement by mid-2024 as we move from El Nino to more normal weather pattern. Fingers and toes
ERYTHRITOL
Let’s face it. For the past 4 years we have all had a tumultuous relationship with erythritol. That stuff was going for $7.00 per KG or higher when the world was coming to an end a few years ago. Some of us made a deal with the devil and signed take-or-pay agreements. Icon Foods doesn’t do that kind of unscrupulous stuff, but there are a few companies that still do. I digress. That high priced material drove a lot of good folks into difficult financial situations. Then the news came out that using erythritol would lead to an early grave which turned out to be utter manure.
There were some brave souls that stuck with it and now they are the benefactors of some fantastic margins because the price of erythritol fell to almost parity with sugar. So, what now?
Erythritol pricing is still at historic lows. This will stay that way for the next few months, but I am starting to see the market contract, and the price and availability is slowly creeping up. However, the market could change on a dime.
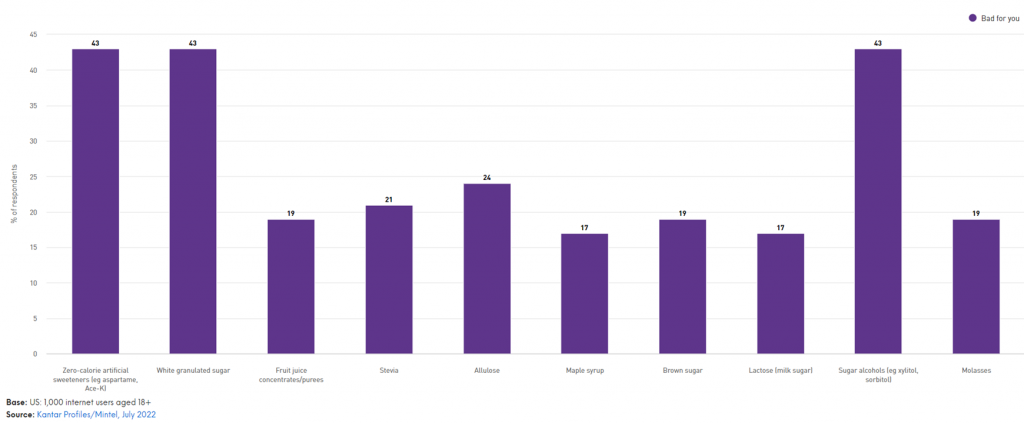
From the perspective of a food scientist who does a lot of formulation, I often get asked, “is anyone actually formulating with erythritol anymore?” The answer is an unequivocable yes. There are still a lot of formulations that use erythritol. Whole Foods, Health Canada, and the EU don’t allow allulose, so there are no real viable options besides erythritol for some formulas. But, based on the graph below, erythritol’s consumer perception could use some work—it is on pare with sugar and aspartame as being “bad for you.” Though the price is nice and low, as I mentioned, we will start to see upward pressure. Likely around June.
Additionally, as we see the corn market begin contracting and all of the surplus material start to dry up, upward movement on price—and perhaps some tightening of supply—will happen. Again, my prediction is June 2024 at the latest.
Call your Icon Foods representative and help us help you get your erythritol needs locked down through 2024.
ALLULOSE
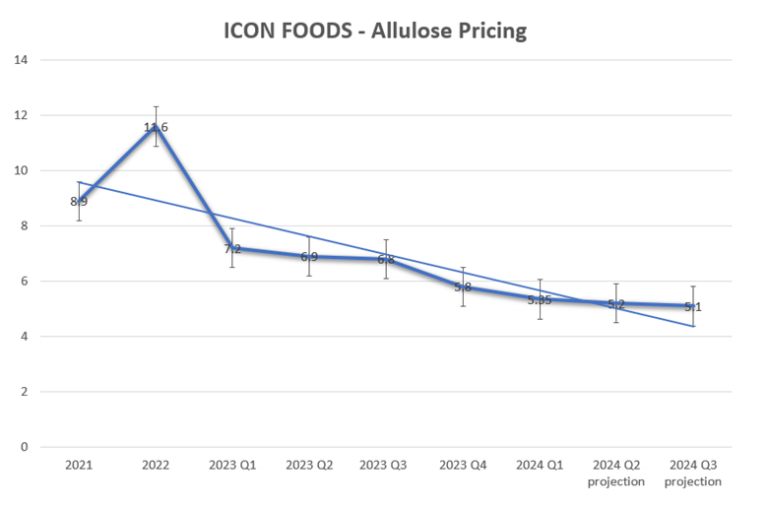
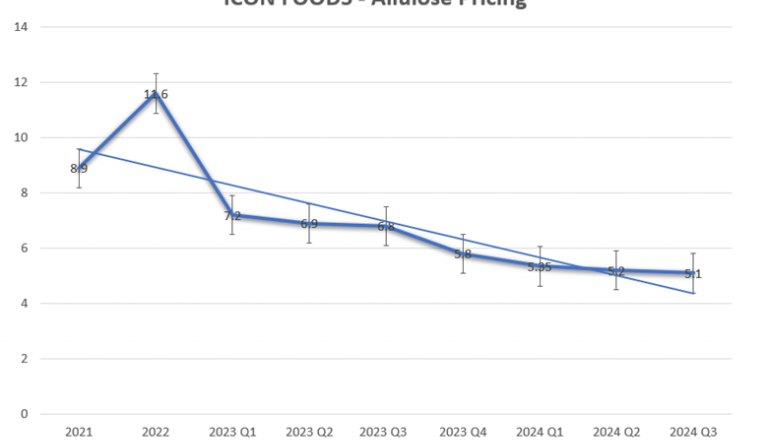
There were several new high-quality producers of crystalline allulose that started scaling in 2022, resulting in more product in the market in 2023 and even more in Q1 of 2024. As you can see on the graph on page 8, this created downward pressure on pricing. Prices went down about 3-5% over the last quarter. Meanwhile, the price of allulose syrup remains very stable, dare I say cheap. For now, crystalline allulose still has a way to go, but time will bring pricing down as more material enters the market. New technologies, which should be emerging in 2025, promise to make allulose competitive with fructose. Wouldn’t that be something?
Health Canada, the EU, and Whole Foods just need to get on board.
Something Icon Foods both has an eye on and a hand in, is bioconversion. We use bioconversion in some of our grades of Reb M steviol glycosides. Now, we are moving full steam ahead into allulose research.
Corn stalks are one of the main agricultural waste biomasses in the world. Bioconversion is one of the the most promising approaches to corn stock upcycling. This is significant for both food safety and reducing carbon emission. A genetically modified Escherichia coli can be used as a catalyst to produce D-allulose from D-glucose—which can be found in corn stalks.
Pretty cool, right? It’s awesome to see how innovation and technology are helping us find new ways to make use of natural resources. Next time you see a corn field, you’ll know there’s more to those stalks than meets the eye. Until that time, below is the trendline for crystalline allulose pricing. Cheaper, but, not quite cheap.

As a food scientist and formulator, allulose is one of the best non-nutritive sweeteners in my arsenal. It is easy to formulate with and plays very well with other sweeteners and fibers. However, it remains a little pricey and with consumers still tightening their belts, keeping your COGS low should be a priority. Using monk fruit and/or stevia with allulose will save you money and allow you to stretch the allulose further. If you need help with the conversion, Icon Foods is here to assist.
XYLITOL
Xylitol prices have been coming down and are stabilized. We get a lot of questions about why xylitol is so expensive. It comes down to water and power—a lot of water and a lot of power is required to get the d-xylose out of the corn cobs and corn by products. China also has a heavy tax on water usage and expensive electricity. The majority of xylitol is derived from corn cobs that do not birch as some people have been led to believe.
Since xylitol is a corn derived ingredient, its cost may rise with the price of corn and when availability wains, which will likely be in late July 2024. This would be an ingredient worth hedging right now since polyols across the board are at historic lows.
INULIN
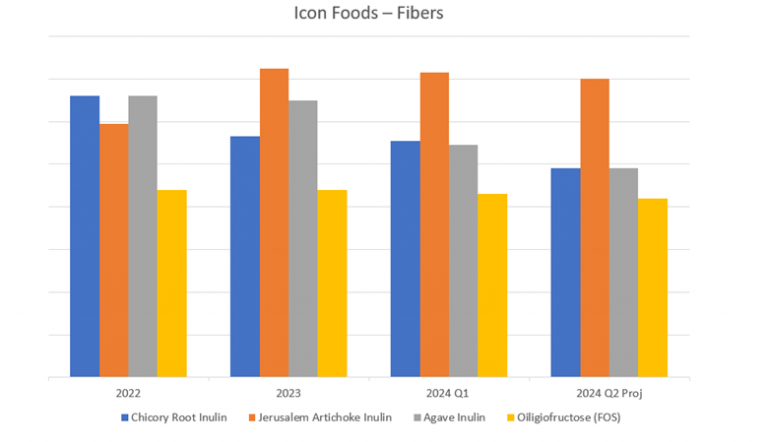
The chicory root inulin supply chain is quite solid; pricing is stable and even down some since a lot of manufactures moved from chicory root inulin to FOS when the price was sky high and supply chains were non-existent. Agave inulin is certainly stable, but somewhat pricey. It appears the abundance of chicory root inulin is putting downward pressure on the other inulin type fibers—except for Jerusalem artichoke. Jerusalem artichoke remains expensive, and the supply chain is not as stable as other options. Since Jerusalem artichoke shares a similar chain length with chicory root and agave inulin, I have not found a real compelling reason to use it as a main fiber source. However, I would still keep it in your toolbox in case the market pulls back, or you get a specific request.
FOS
While FOS may not have the jelling properties of chicory, Jerusalem artichoke, or agave—mostly because of chain length—FOS still holds up well in most processes, dissolves quickly with little turbidity, and is a fantastic prebiotic fiber. Stacking FOS with soluble tapioca fiber and another inulin of a different chain length will allow for more fiber in your formula, giving you excellent gelling and stabilizing potential gastro-intestinal effects that may occur from too much dietary fiber.
SOLUBLE TAPIOCA FIBER
Soluble tapioca fiber remains the gold standard for fiber from an Icon Foods’ prospective. The price will not be driven up by the corn market. It is not manufactured in China, thus not subject to the 25% tariff. Functionally, it’s an RS4 resistant dextrose or resistant starch that adds fiber and works well in keto and low-carb products, and in applications where fiber and exceptional gelling properties are needed to contribute to mouthfeel. Icon Foods is very well positioned in soluble tapioca fiber. The price is much lower than soluble corn fiber and you won’t have “corn” in your ingredient dec. Many functional beverage companies and food manufacturers are migrating to soluble tapioca fiber to achieve a grain-free claim. I would expect the supply to contract slightly starting late Q3 of this year and put upward pressure on cost in Q4 2024. Particularly, if there is extreme weather in Southeast Asia. Cassava Root, which tapioca is derived from, is susceptible to extremes. If crops crash, shortages and price escalations can happen very quickly. Lock in for price stability.
STEVIA
China produces over 80% of stevia extract distributed around the world—having a finger on the pulse of this sweet commodity can really help with predictive analysis when it comes to pricing.
Last September’s harvest was glorious for stevia leaf and leaf conversions.
2024 planting area of stevia this year has increased by 20% – 30%. More planting area, more plants.
Stevia is mostly propagated from clippings and grown in massive green houses that stretch for hundreds of miles. The ratio of seedlings to seed crops is 95% verse 5%.
Clippings enable the plant to leverage specific glycosides, like Reb M for instance. This process has contributed to a significant drop in Reb M prices.
The harvest occurs in September, the bounty of extract will likely start showing up in early November 2024. Prices for leaf extract will see upward pressure in late Q2 through Q3 as 2023 stock gets depleted. Lock your position in now to get over the price hump.
Bioconversion and enzymatic processes will fill a lot of the gaps and may apply downward pressure on pricing. However, if your need is organic leaf extract, the prudent buyer would lock their positions in through the remainder of 2024. While prices may rise over the next few months, never fear—like all things in this world, it will be temporary. Look for a pullback in late Q4 2024 or early Q1 of 2025.
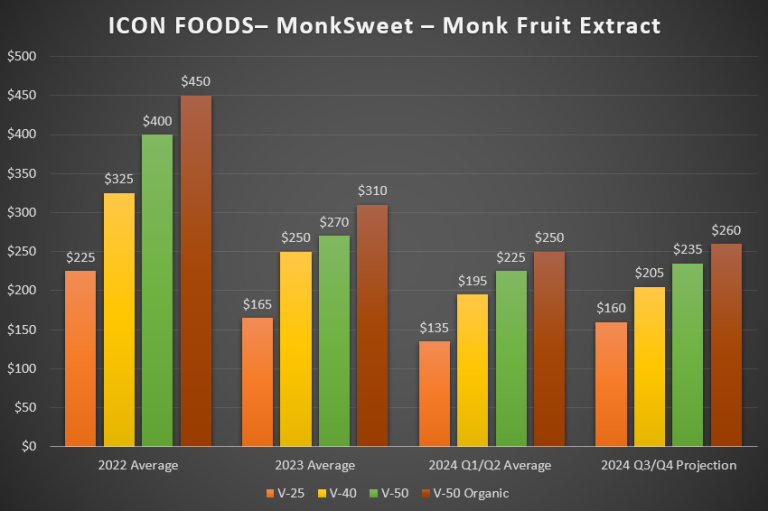
MONK FRUIT
After a significant spike in price in 2022 followed by stabilization in 2023, now through Q2 2024 looks to be the window to buy. Over the next 2-3 months, monk fruit prices will stay stable and come up 4-6%. In June or July is when we will start to see the typical upward pressure on pricing because of depleted stock—there could be a jump of 15-20%. 2023 brought a record harvest which triggered significant price drops in 2022-23 material still in stock. While that applied nice downward pressure on pricing as suppliers try to churn this remaining stock, in the next 30-60 days we will start seeing this come up. Prices are stable right now. At best you have until the end of May to take advantage of remaining stock. I would stock up.
SUMMARY
The world seems to be less on fire. Maybe we are just getting used to the new normal. We saw a lot of really great brands go under over the past few years. However, there is quite a bit of light at the end of the tunnel. I promise you we are not on a runaway train. Consumer spending is on the rise. The economy hasn’t been this vibrant in a decade—jobs are plentiful and there is a stir in innovations. Most of these innovations are trying to get ahead of consumer demand and trends. Sugar is way up, but consumer demand is down. Folks are becoming more aware of what they are putting in their mouths. The biggest thing on the horizon are GLP-1 agonists and how they will affect the CPG industry. This market is wide open for those brave enough to jump in. Last week, I saw a lot of propaganda regarding GLP-1 and blood sugar management. Large CPG’s are freaking out. Now is the time to capitalize on this trend. If you thought keto was big, GLP-1 will dwarf that trend. Icon Foods is here to help with our sweeteners, sweetening systems, fibers and inclusions all designed to make deep clean cuts to added sugars and make your nutritional fact panel shine. Icon spells innovation.
Thank all of you for your kind comments regarding my last market intelligence report. That means a lot, but what would mean even more is if you told me what I can do better and how Icon Foods and I can be a resource for you.
Thank you for your continued support.
Thom King
Sources
- Casey, Chris. “Cocoa Supply Issues Could Lead to Smaller Chocolate Bar Sizes: …” Food Dive, 13 Feb. 2024,www.fooddive.com/news/cocoa-supply-smaller-chocolate-bar-sizes-kinaxis-ivory-coast-hershey-mondelez-easter-candy-prices/707370/.
- Dezember, Ryan. “Cocoa Prices Surge Past a 46-Year Record.” The Wall Street Journal, 8 Feb. 2024, www.wsj.com/livecoverage/stock-market-today-dow-jones-earnings-02-08-2024/card/cocoa-prices-surge-past-a-46-year-record-g0cpLc8Is8Sb83c9qrbC.
- Drouga, Jenny. “Panama Canal Drought Issues Improved, but Not Eradicated.” LinkedIn, 4 Mar. 2024, www.linkedin.com/pulse/panama-canal-drought-issues-improved-eradicated-jenny-drouga-rs8yf/?trk=article-ssr-frontend-pulse_more-articles_related-content-card.
- Eastlake, Donna. “The Cost of Sugar Is Soaring: What Does This Mean for Food Manufacturers and Consumers?” Foodnavigator.Com, 4 Feb. 2024, www.foodnavigator.com/Article/2024/02/06/The-cost-of-sugar-is-soaring-What-does-this-mean-for-food-manufacturers-and-consumers.
- Fortinsky, Sarah. “Cocoa Prices Reach Record High Ahead of Valentine’s Day.” The Hill, The Hill, 14 Feb. 2024, thehill.com/business/4463730-cocoa-prices-record-valentines-day/.
- Kingston, John. “U.S. Bank Index Variances Suggest Possible Bottom for Excess Capacity.” FreightWaves, 5 Feb. 2024, www.freightwaves.com/news/u-s-bank-index-variances-suggest-possible-bottom-for-excess-capacity.
- Prakash, Prarthana. “Millennials and Gen Z’s Rebellion against Their Parents’ Rules Is Spawning a $181 Billion Industry That Makes Everything into a Snack.” Fortune, Fortune, 30 May 2023, fortune.com/2023/05/15/millennials-gen-z-snacking-spawned-181-billion-industry-food-meals/.
- Selyukh, Alina. “Cocoa Prices Spiked to an All-Time High Right before Valentine’s Day.” NPR, NPR, 12 Feb. 2024, www.npr.org/2024/02/12/1230120289/valentines-day-chocolate-cocoa-prices.
- Sterk, Ron. “Cocoa Bean Futures at All-Time High.” Baking Business, Baking Business, 8 Feb. 2024, www.bakingbusiness.com/articles/60840-cocoa-bean-futures-at-all-time-high.
- “Summary Findings.” USDA ERS, 23 Feb. 2024, www.ers.usda.gov/data-products/food-price-outlook/summary-findings/.
- Westwater, Thomas. “Corn Prices Face Tough Outlook as Global Supply Swells.” Tastylive, 11 Jan. 2024, www.tastylive.com/news-insights/Corn-Prices-Face-Tough-Outlook-as-Global-Supply-Swells.